This research determined the effect of monosodium glutamate (MSG) on selected tissue lipids and haematological indices of neonatal and adult Wistar rats. Pups were administered 4 mg/kg MSG on postnatal days 2, 4, 6, 8, and 10, raised for 32 weeks, and afterwards divided into 3 groups (n = 7) and administered saline, 5 and 10 mg/kg body weight of MSG, respectively, for 6 weeks. Two other groups, not exposed to MSG at neonatal age, were similarly administered 5 and 10 mg/kg body weight of MSG, respectively, for 6 weeks. The control received saline. Serum and brain lipids and haematology were determined and compared. Body weight was found to decrease (P<0.05) in animals exposed to MSG. The brain weights and lipids were found to increase but non-significantly, relative to normal control. Serum lipids decreased in groups previously exposed to MSG at the neonatal stage. Wistar rats exposed to MSG at the adult stage only showed an increased level of serum lipids. The red blood cells, haemoglobin and haematocrit decreased in groups exposed to MSG at both neonatal and adult stages. The white blood cells, lymphocytes, granulocytes, and platelets revealed increased levels in all MSG-exposed rats. In sum, the effects of adult and neonatal exposure to MSG were similar–both caused weight disorientation and dyslipidaemia, increased tendency to induce anaemia and tissue inflammation. Hence the biochemical basis for which neonates rather than adult rats are used in MSG-obesity induction may not reside in lipid metabolism and the haematopoietic system.
Introduction
Food additives are used to enhance the taste, aroma, or colour of food, making the food more palatable and enjoyable. However, the use of certain food additives is reported to be detrimental to health (Recoules et al., 2025; Urrutia-Pereraa et al., 2025). One of such food additives, monosodium glutamate (MSG), could pose danger to health when not used in moderation. Monosodium glutamate is the sodium salt of L-glutamate, a dicarboxylic amino acid. The sodium and water contents are about 22% and 78% glutamate, respectively (Cakmakci & Salik, 2022; Bayram et al., 2023; Kayode et al., 2023). In Nigeria, it is commonly known as white magi and is sold under several brand or trade names (Utume et al., 2020).
Monosodium glutamate is used in different food forms, including snacks, chicken and turkey, chips, soups or sauces, cooked meals, preserved foods, sausages, bottled soy or oriental sauces, vegetarian burgers, processed meats, and flavoured tuna (Katranci et al., 2024). Its availability and ability to enhance food taste leaves the consumers in demand for “extra plates” and make it one of the food additives that is widely used in commercially packed foods, restaurants, and household cooking (Iannilli et al., 2024; Ogunmokunwa & Ibitoye, 2025).
However, there are grave concerns raised about its safety and toxicity both in humans and experimental animals (Banerjee et al., 2021; Farhat et al., 2021). For instance, the popular “Chinese restaurant syndrome” is said to result from its incorporation in food. The disease is noted with lots of body disturbances and inconveniences such as an inclination to vomit, perspiration, and pain in the neck region (Shastri et al., 2023).
In animal studies, MSG has been reported to cause endocrine disorder, brain cell damage (neurotoxicity), obesity, and retinal degeneration (Alhamed et al., 2021; Yang et al., 2023). In experimental disease models, MSG is a neurotoxic food additive that has been used to induce animal models of obesity. In such a procedure, the MSG is administered to neonatal rats and raised normally to become obese within 10 - 14 weeks. To our knowledge, matured rats are rarely used for this purpose. Yet, there is the expressed fear of the risk of obesity in humans upon the consumption of MSG-flavoured foods.
In a bid to understand, at least in part, the biochemical reason for this difference in the effect of MSG when administered to neonates and mature rats, the present study exposed MSG to both young and mature rats in graded concentrations and compared its impact on selected tissue lipids and haematological indices. Rotimi et al. (2012) had found that MSG administered to neonatal rats to induce obesity resulted in increased levels of lipids (dyslipidemia) in the blood tissue. However, this dyslipidemia, a feature of MSG-induced obesity, has not been reported in matured animals exposed to MSG. Consequently, transport lipids in the blood and the brain (MSG target tissues) were studied. Moreover, given the reported correlation between dyslipidemia and altered blood function, the haematopoietic system was also studied.
Materials and Methods
Animals
Female and male adult Wistar rats were obtained from the animal house, College of Medical Sciences, University of Calabar, and cohabited in the ratio of 3:2. They were housed under standard conditions and had free access to tap water and standard rat pellets. The pubs produced were used for the experimental studies.
Soon after delivery, the pubs were randomly divided into 2 groups. The first group was administered 4mg/g b.w of MSG (reconstituted in normal saline) via intraperitoneal injections, just after birth on days 2, 4, 6, 8, and 10. The other group was not treated with MSG. On the 21st day, pubs in both groups were separated from their mothers (weaned) and raised normally to maturity. Upon maturity, the two groups were subdivided into three groups each – groups 1 – 3, comprised of neonatal MSG-treated rats, and groups 4–6, comprised of normal rats, respectively. These six groups were then subjected to 6-week MSG treatment as shown in Table 1 below. The MSG was administered orally once a day.
Table 1. Experimental design, animal grouping and treatment schedule
|
S/N |
Groups |
Neonatal MSG (4mg/kg) |
6-week MSG |
|
1 |
MSG4/0 |
4 mg/kg b.w. MSG |
Normal saline |
|
2 |
MSG4/5 |
4 mg/kg b.w. MSG |
5 mg/kg b.w. |
|
3 |
MSG4/10 |
4 mg/kg b.w. MSG |
10 mg/kg b.w. |
|
4 |
NC0/0 |
|
Normal saline |
|
5 |
MSG0/5 |
|
5 mg/kg b.w. |
|
6 |
MSG0/10 |
|
10 mg/kg b.w. |
MSG4/0 = MSG control: received 4mg/g body wt (b.w) + normal saline at adult stage, MSG4/5 = Group which received 4mg/g b.w MSG at neonatal stage + 5mg/kg b.w MSG at adult stage, MSG4/10 = Group which received 4mg/g b.w MSG at neonatal stage + 10mg/kg b.w MSG at adult stage, NC0/0 = normal control: received normal saline only at adult stage, MSG0/5 = Group which received 5mg/kg b.w MSG at adult stage only, MSG0/10 = Group which received 10mg/kg b.w MSG at adult stage only.
Termination of Experiment, Sample Collection and Preparation
After the 6-week therapy, the Wistar rats were sacrificed, and their complete blood was taken by heart puncture into simple tubes and a part into ethylene diamine tetraacetic acid (EDTA)-containing tubes. The blood obtained in EDTA tubes was utilized to evaluate full blood counts (haematological analysis), whereas the plain tubes were left to clot for around an hour before being centrifuged at 3000 revolutions per minute (rpm) for 10 minutes. Serum was properly obtained and utilized for the lipid profile test. The corpses were beheaded, and the complete brain was taken by breaking the skull, weighed, and placed in a phosphate buffered saline (PBS), pH 7.4, placed in an ice cold, and then utilized for brain homogenate preparation
Biochemical Analysis
Brain Whole Homogenate and Serum Lipid Assays
The whole brain was completely homogenized in 5ml PBS and thereafter centrifuged at 2000 rpm for 30 minutes and allowed to stand for 10 minutes, and the supernatant was separated into plain tubes. This supernatant and the serum were used for lipid assays. The Randox assay kits were used for the evaluations thus: Total cholesterol (T- chol) was estimated based on the method of Roeschlau et al. (1974). Triacylglycerol (TAG) was determined according to the method of Tietz (1986). High density lipoprotein cholesterol (HDL-c) concentration was estimated according to the method of Albers et al. (1978). Very low density lipoprotein cholesterol (VLDL-c) and low density lipoprotein cholesterol (LDL-c) were estimated or derived according to Friedewald’s formula for lipids derivation.
Friedewald’s Formula for Lipids Derivation
|
VLDL-chol = TAG/5 |
(1) |
where; VLDL-chol represents very low density lipoprotein cholesterol and TAG represents Triacylglycerol.
|
LDL-chol = (T-chol) – (HDL-c) – TAG/5 |
(2) |
Where; LDL-chol is low density lipoprotein cholesterol, T-chol is total cholesterol and HDL-chol is high density lipoprotein cholesterol.
Haematological Analysis
Blood indices were analysed using automated blood cell analyzer, Model PCE 2010, Japan. The assays were carried out according to the manufacturer’s manual.
Statistical Analysis
Data obtained were analysed using One Way Analysis of Variance (ANOVA) together with post hoc test at P< 0.05. Statistical Package for Social Science (SPSS) Software version 20.0 was used for the analysis.
Results and Discussion
Body and Brain Weights
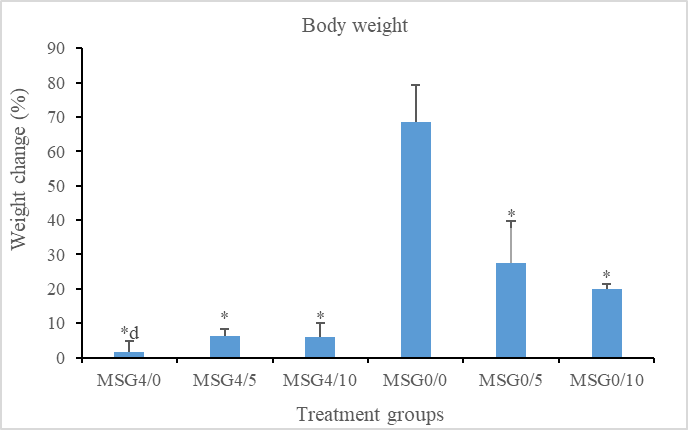
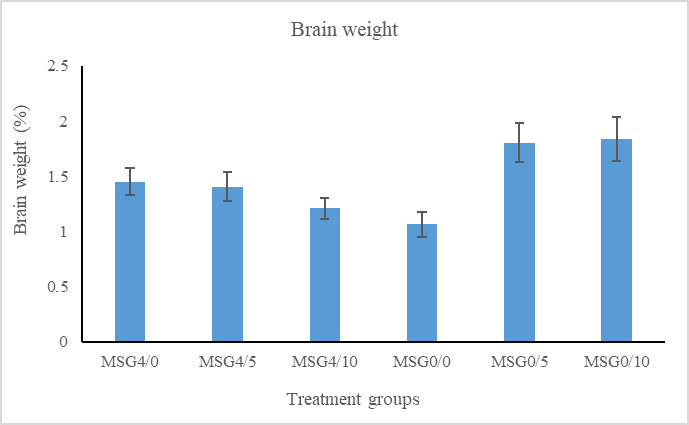
The effect of MSG on the relative body and brain weight (in percentages) of neonatal and adult exposed Wistar rats was evaluated in this study. The result showed a decrease (P < 0.05) in the percentage of body weight change of Wistar rats in all groups exposed to MSG when compared with the normal control group. The MSG control group also showed a decrease (P < 0.05) in relation to the group that received 5mg/kg b.w. at the adult stage only. The relative brain weight showed marginal increases (P > 0.05) in MSG-exposed groups relative to the normal control group. The results are shown in Figures 1 and 2, respectively.
|
|
|
Figure 1. Effect of Monosodium glutamate (MSG) on body weight of experimental Animals. Values are expressed as means + SEM; (n = 7 rats per group) * = significantly different from MSG0/0 (P < 0.05) and d = significantly different from MSG0/5 (P < 0.05). Legend: MSG4/0 = MSG control: received 4mg/g body wt (b.w) + normal saline at adult stage, MSG4/5 = Group which received 4mg/g b.w MSG at neonatal stage + 5mg/kg b.w MSG at adult stage, MSG4/10 = Group which received 4mg/g b.w MSG at neonatal stage + 10mg/kg b.w MSG at adult stage, NC0/0 = normal control: received normal saline only at adult stage, MSG0/5 = Group which received 5mg/kg b.w MSG at adult stage only, MSG0/10 = Group which received 10mg/kg b.w MSG at adult stage only. |
|
|
|
Figure 2. Effect of Monosodium glutamate (MSG) on relative brain weight of Exper imental animals. Values are expressed as means + SEM; (n = 7 rats per group). No significantly difference among the groups. Legend: MSG4/0 = MSG control: received 4mg/g body wt (b.w) + normal saline at adult stage, MSG4/5 = Group which received 4mg/g b.w MSG at neonatal stage + 5mg/kg b.w MSG at adult stage, MSG4/10 = Group which received 4mg/g b.w MSG at neonatal stage + 10mg/kg b.w MSG at adult stage, NC0/0 = normal control: received normal saline only at adult stage, MSG0/5 = Group which received 5mg/kg b.w MSG at adult stage only, MSG0/10 = Group which received 10mg/kg b.w MSG at adult stage only. |
Brain Lipid Profile
The results on brain TC, TAG, HDL-c, VLDL-c, and LDL-c revealed that all the MSG-treated groups showed a non-significant (P > 0.05) increase when compared with the normal control, with the exception of the group exposed to 4mg/kg b.w. and 5mg/kg b.w. MSG at neonatal and adult stages, respectively (MSG4/5), whose levels of brain lipids decreased when compared with the normal control. There was a substantial reduction (P < 0.05) in TC, TAG, VLDL-c, and LDL compared to MSG4/0, MSG4/10, MSG0/5, and MSG0/10 (Table 2).
Serum Lipid Profile
The results of the effect of MSG on the serum lipid profile showed decreases in TC, TAG, VLDL-c, HDL-c, and LDL-c in all the groups that were exposed to MSG at the neonatal stage. This decrease was found to be significant in HDL-c in the group exposed to 4 and 5mg/Kg b.w MSG at the neonatal and adult stages, respectively (MSG4/5), when compared with the normal control. The result of serum lipids also showed there was an increase in the groups exposed to MSG at the adult stage only (MSG0/4 and MSG0/5). The increase was significant (P < 0.05) when compared with groups that were previously exposed to MSG at the neonatal stage and in TAG and VLDL-c levels when compared with the normal control (Table 3).
Table 2. Brain lipid profile
|
GROUPS |
TC |
TAG |
HDL-C |
VLDL-C |
LDL-C |
|
MSG4/0 |
154.70 ± 12.98b |
169.83 ± 10.59b |
63.01 ± 2.28 |
33.97 ± 2.12b |
57.72 ± 10.42 |
|
MSG4/5 |
117.56 ± 7.86 |
146.64 ± 4.36 |
57.91 ± 4.17 |
29.33 ± 0.87 |
30.32 ± 8.73 |
|
MSG4/10 |
166.19 ± 12.90b |
173.61 ± 10.60b |
65.97 ± 4.16 |
34.72 ± 2.12b |
65.49 ± 9.22b |
|
MSG0/0 |
148.06 ± 8.65 |
167.00 ± 6.57 |
58.97 ± 0.83 |
33.40 ± 1.31 |
55.69 ± 7.07 |
|
MSG0/5 |
156.51 ± 13.23b |
172.94 ± 9.33b |
62.39 ± 1.20 |
34.59 ± 1.87b |
59.53 ± 10.80b |
|
MSG0/10 |
158.35 ± 11.71b |
169.72 ± 4.18 |
63.21 ± 2.24 |
33.94 ± 0.84 |
61.20 ± 9.49b |
Values are expressed as Means + SEM; (n = 7) b = significant difference MSG4/5 at P<0.05. TC = total cholesterol (mg/dl), TAG = Triacylglycerol (mg/dl), HDL-c = High density lipoprotein cholesterol (mg/dl), VLDL-c = very low density lipoprotein cholesterol (mg/dl) and LDL-c = low density lipoprotein cholesterol (mg/dl). Legend: MSG4/0 = MSG control: received 4mg/g body wt (b.w) + normal saline at adult stage, MSG4/5 = Group which received 4mg/g b.w MSG at neonatal stage + 5mg/kg b.w MSG at adult stage, MSG4/10 = Group which received 4mg/g b.w MSG at neonatal stage + 10mg/kg b.w MSG at adult stage, NC0/0 = normal control: received normal saline only at adult stage, MSG0/5 = Group which received 5mg/kg b.w MSG at adult stage only, MSG0/10 = Group which received 10mg/kg b.w MSG at adult stage only.
Table 3. Serum lipid profile
|
GROUPS |
TC |
TAG |
HDL-C |
VLDL-C |
LDL-C |
|
MSG4/0 |
149.77 ± 13.84d |
162.23 ± 10.84de |
50.64 ± 0.65 |
33.05 ± 2.17de |
66.09 ± 11.61 |
|
MSG4/5 |
133.91 ± 11.39d |
162.93 ± 7.60de |
49.15 ± 1.42* |
32.59 ± 1.52de |
52.18 ± 9.17d |
|
MSG4/10 |
137.31 ± 15.02d |
159.37 ± 4.27de |
52.75 ± 2.50 |
31.87 ± 0.85de |
52.69 ± 13.38d |
|
MSG0/0 |
156.86 ± 1.37 |
162.95 ± 3.09 |
53.49 ± 1.59 |
34.25 ± 0.27 |
69.12 ± 2.53 |
|
MSG0/5 |
179.05 ± 2.43 |
189.52 ± 1.79* |
53.88 ± 0.99b |
37.90 ± 0.36* |
87.27 ± 2.04 |
|
MSG0/10 |
162.55 ± 4.97 |
185.19 ± 5.01* |
53.65 ± 1.04b |
37.04 ± 1.00 |
71.86 ± 4.01 |
Values are expressed as Means + SEM (n = 7) * = significantly different from MSG0/0 (P < 0.05), b = significantly different from MSG4/5 (P < 0.05), d = significantly different from MSG0/5 (P < 0.05) and e = significantly different from MSG0/10 (P < 0.05). TC = total cholesterol (mg/dl), TAG = Triacylglycerol (mg/dl), HDL-c = High density lipoprotein cholesterol (mg/dl), VLDL-c = very low density lipoprotein cholesterol (mg/dl) and LDL-c = low density lipoprotein cholesterol (mg/dl). Legend: MSG4/0 = MSG control: received 4mg/g body wt (b.w) + normal saline at adult stage, MSG4/5 = Group which received 4mg/g b.w MSG at neonatal stage + 5mg/kg b.w MSG at adult stage, MSG4/10 = Group which received 4mg/g b.w MSG at neonatal stage + 10mg/kg b.w MSG at adult stage, NC0/0 = normal control: received normal saline only at adult stage, MSG0/5 = Group which received 5mg/kg b.w MSG at adult stage only, MSG0/10 = Group which received 10mg/kg b.w MSG at adult stage only.
Haematology
The result of the effect of MSG on haematological indices in neonatal and adult exposed Wistar rats revealed a decreased (P > 0.05) concentration in red blood cell counts (RBC), haemoglobin (HGB), and haemotocrit (HCT) in groups exposed to MSG at the neonatal and adult stages (MSG4/5 and MSG4/10) with significance in HGB concentration in the group treated with MSG4/5 when compared with the normal control. The MSG control group showed increased concentrations of RBC counts, HGB, and HCT, which was not significant when compared with the normal control, except with the MSG4/5 and MSG4/10 groups. The groups exposed to MSG at the adult stage only (MSG0/5 and MSG0/10) showed a non-significant difference in RBC counts, HGB, and HCT when compared with the normal control (Table 4). The white blood cells (WBC), lymphocytes (LYM), granulocytes (GRA), and platelets (PLT) results revealed an increased level (P > 0.05) in all MSG-exposed rats, except the MSG control group, which showed a decrease when compared with the normal control. The decrease was also observed in PLT level in the group treated with 10mg/kg b.w MSG at the adult stage only (MSG0/10) (Table 5).
Table 4. Haematological indices of experimental animals
|
Groups |
RBC (1012/l) |
HGB (g/dl) |
HCT (%) |
|
MSG4/0 |
9.11+0.15c |
15.10+0.20b |
54.17+0.55 |
|
MSG4/5 |
8.56+0.28 |
14.36+0.27* |
52.26+0.73 |
|
MSG4/10 |
8.00+0.66 |
15.00+0.26 |
50.11+3.60 |
|
MSG0/0 |
8.63+0.23 |
15.08+0.30 |
53.85+1.20 |
|
MSG0/5 |
8.71+0.17 |
15.10+0.20b |
53.79+0.80 |
|
MSG0/10 |
8.64+0.46 |
14.45+0.20 |
51.71+0.38 |
Values are expressed as Means + SEM; n = 7. * = significantly different from MSG0/0 (P < 0.05), a = significantly different from MSG4/5 (P < 0.05) and c = significantly different from MSG4/10 (P < 0.05). RBC = Red blood cell counts, HGB = Haemoglobin, HCT = Haematocrit. No significant difference (P< 0.05) between the groups. Legend: MSG4/0 = MSG control: received 4mg/g body wt (b.w) + normal saline at adult stage, MSG4/5 = Group which received 4mg/g b.w MSG at neonatal stage + 5mg/kg b.w MSG at adult stage, MSG4/10 = Group which received 4mg/g b.w MSG at neonatal stage + 10mg/kg b.w MSG at adult stage, NC0/0 = normal control: received normal saline only at adult st age, MSG0/5 = Group which received 5mg/kg b.w MSG at adult stage only, MSG0/10 = Group which received 10mg/kg b.w MSG at adult stage only.
Table 5. Haematological indices of experimental rats
|
Group |
WBC (109/l) |
LYM (109/l) |
GRA (109/l) |
PLT (109/l) |
|
MSG4/0 |
8.46 +1.03 |
6.39 +0.99 |
0.99+0.12 |
650.00+46.26 |
|
MSG4/5 |
15.08+2.82 |
10.36+1.91 |
2.13+0.91 |
778.00+62.22 |
|
MSG4/10 |
20.64+8.77 |
11.60+3.77 |
4.89+3.23 |
778.00+62.22 |
|
MSG0/0 |
11.50+2.74 |
8.39 +2.21 |
1.39+0.29 |
746.00+46.3 |
|
MSG0/5 |
12.73+2.77 |
8.65 +2.33 |
2.21+0.37 |
763.00+42.53 |
|
MSG0/10 |
16.46+3.02 |
10.93+0.55 |
2.91+1.49 |
745.50+104.21 |
Values are expressed as Means + SEM; n = 7. WBC = White blood cell count, LYM = Lymphocytes, GRA = Granulocyte and PLT = Platelet. No significant difference (P< 0.05) between the groups. Legend: MSG4/0 = MSG control: received 4mg/g body wt (b.w) + normal saline at adult stage, MSG4/5 = Group which received 4mg/g b.w MSG at neonatal stage + 5mg/kg b.w MSG at adult stage, MSG4/10 = Group which received 4mg/g b.w MSG at neonatal stage + 10mg/kg b.w MSG at adult stage, NC0/0 = normal control: received normal saline only at adult stage, MSG0/5 = Group which received 5mg/kg b.w MSG at adult stage only, MSG0/10 = Group which received 10mg/kg b.w MSG at adult stage only.
The current study evaluated the effect of neonatal and adult exposures to monosodium glutamate on selected tissue lipids and haematological indices of Wistar rats. Percentage changes in body and brain weight of the animals were measured as part of this study. The results generally showed decreases in body weights of MSG-exposed rats in comparison with the normal control group. The decrease was in line with earlier findings. Moreover, there was no significant effect on weight gain or lee index of rats following Monosodium glutamate exposure (Pakpahan & Edianto, 2021; Rahayu & Wahyuni, 2021). Although Rotimi et al. (2012) and Alalwani (2014) reported weight gains following MSG administration in rats, stating that MSG probably enhances foods palatability by acting on the appetite center in the brain (Alalwani, 2014). Reports by Abd El-Aziz et al. (2014) explain a unique pattern of MSG – induced obesity in which there would be body weight gain at initial exposure followed by weight loss of Wistar rats at 6 weeks and 6 months, respectively, before noticeable weight regain at the 14–months. However, this study terminated before the 14-month period to record weight gain, hence decreased body weight in MSG-treated animals.
According to Abd El-Aziz et al. (2014), the weight loss associated with MSG administration in animals could be due to the mal-absorption of food caused by gastric mucosa damage induced by MSG. Iwase et al. (2000) reported that MSG intake damages neuropeptide Y mRNA, which stimulates food intake at an early period of exposure and suppresses leptin at a prolonged duration (14 months) of MSG administrations (Wang et al., 2024); hence, the time-course body weight changes. The inconsistencies in the available reports based on animal body weight changes upon exposure to MSG could result from variations in dosage, chronic or acute exposure, strain of the experimental animals, period in life when the animals were exposed to MSG and the duration of exposure (Jasinska-Stroschein & Orszulak-Michalak, 2021; Jeong et al., 2021; Bevzo, 2024).
Brain weight of MSG treated rats was also found to marginally increase when compared with the normal control group, indicating inflammation caused by MSG in the brain cells resulting probably from MSG-induced excessive firing of the neurons which concurs with the report of Bannai and Torii (2013). Also, monosodium glutamate has been implicated in organ inflammation (Kumari et al., 2023). Although Abu-Taweel et al. (2014) have indicated in their study that MSG had no effect on the relative forebrain owing to the brain-sparing phenomena; however, results in this study suggest that glutamate can permeate the blood brain-barrier (BBB) into the brain through the existing facilitative transport system (Gruenbaum, et al., 2024).
Changes between the research groups were seen in the brain lipids of the rats exposed to MSG. The higher lipid level compared to the normal control, albeit not statistically significant, raises the possibility that MSG may have disrupted glucose metabolism through the TCA cycle, causing a change in the brain toward lipogenesis (the production of cholesterol and triacylglycerol) (Andersen & Schousboe, 2023). A higher HDL-c level also indicates that the reverse cholesterol transfer was unhindered. According to Hawkins and Vina (2016), the brain is a lipid-laden tissue, so the non-significant increases in brain lipids seen in MSG-treated groups may be caused by the fact that synthesis must be significantly increased or suppressed to change the normal level or produce discernible changes (Zhang et al., 2025).
The serum TC, TAG, VLDL-c and LDL-c, values decreased in the groups previously exposed to MSG at the neonatal stage (MSG) in comparison with the group that received normal saline. The observed decrease in serum lipids could be said to have resulted from sporadic pattern of MSG effects on rats upon exposure. This pattern was confirmed in the observed increases of lipids in groups exposed to MSG at adulthood only when compared with normal control. The change in serum lipid components upon MSG exposure is an indication that MSG interferes with functional integrity of the liver (Banerjee et al., 2020; Adikwu et al., 2025). This is in agreement with Ibegbulem et al. (2016), who reported an increase in lipids components following the administration of MSG, buttressing interference of MSG with hepatocytic function. Also, Alwaleedi (2016) has reported on similar lipids changes following MSG oral administration in rats. Moreover, El-Ezaby et al. (2018) explained that the increase observed with lipids components upon exposure to MSG could be due to its influence on beta-hydroxyl, methyl glutaryl reductase (β-HMG CoA reductase) and pyruvate kinase. Both enzymes are rate limiting enzymes in cholesterol synthesis and glycolytic pathway, respectively (Lins et al., 2022; Parekh et al., 2024). The decrease observed in HDL-c could be due to the ability of MSG to induce atherosclerosis in rats exposed MSG at neonatal stage (Bevzo, 2025).
The results of MSG effect on treated rats showed decreases in RBCs count HGB and HCT concentrations in Wistar rats exposed to MSG at the neonatal and adult stage, except MSG control. The reduction in erythroid series (RBCs, HGB and HCT) suggests increased inhibited erythropoiesis and release from bone marrow which agreed with the work of Ajibola et al. (2012). This reduction, also, is attributable to outset of haemolysis. Haemolysis or apoptosis caused by MSG administration to Wistar rats, is associated with the sodium components of MSG, which has the propensity to induce ionic imbalance in and around the blood cells. Mammalian red cells are noted for shrinkage when placed in hypertonic environments (Klbik, 2024). Moreover, MSG might have had direct toxicity effect, as a toxin, on the cells and tissues of the experimental animals supporting the report of Rajendran et al. (2023).
The observed marginal increases associated with WBC, LYM, GRA and PLT in MSG-exposed groups (neonatal and adult), affirmed the reports that MSG induces toxicity in the body of animals. White blood cells are known for combating toxic agents in the body via immune system (Tigner et al., 2022). Increased levels of WBC could be indicative of the presence of MSG being detected as toxic agent in the body. This was in agreement with the work of Ghadhban, (2017) whose report showed increased levels of WBC in MSG treated rats. The WBCs, LYM and GRA are responsible for the body defense against xenobiotics. An increase in the body defense agents observed in groups of Wistar rats administered high doses of MSG except MSG control group, supports the general principle that the dose of any substance determines its toxicity. The biosynthesis of cells involved in immunity increases in living system with the presence of toxic substances (Bou et al., 2021; Evbuomwan et al., 2023). The increased percentage of PLT was consistent with the report of Gbore et al. (2016) who also reported non-significantly increased level of PLT upon MSG exposure in animals when compared with the control. The marginal increase could have been triggered by increased secretion of clotting factor to seal the lesions allegedly caused by MSG in the organs of the experimental animals, buttressing the reports of Shibeko et al. (2020).
Conclusion
This study aimed at determining the effect of neonatal and adult exposures to MSG on selected tissue lipids and haematological indices of Wistar rats. The results showed that MSG caused a change in body weight and increased brain weight – a possible inflammatory effect of MSG on the brain of Wistar rats. The results also revealed dyslipidemia following MSG exposure with a tendency to induce obesity. The data suggests that MSG may cause anaemia and inflammatory lesions in organs. Moreover, the data obtained also suggest that the effects of adult and neonatal exposure to MSG are similar – both caused weight loss and dyslipidemia and increased a tendency to induce anaemia and tissue inflammation.
Acknowledgments: We thank the input of Mr. Andrew Akikpo, a Technologist in Anatomy Department, University of Calabar, for assisting in the tissue collection of laboratory animals.
Conflict of interest: None
Financial support: None
Ethics statement: Ethics approval for the study was obtained from the College of Medical Sciences Animal Research Committee of the University of Calabar, Calabar, Nigeria.
Abd El-Aziz, G. S., Magdy, O. E., Sherif, M. H., & Mohamed, H. B. (2014). Effects of prolonged oral intake of monosodium glutamate (MSG) on body weight and its correlation to stomach histopathological changes in male rats. Thailand Journal of Veterinary Medicine, 44(2), 201-208.
Abu-Taweel, G. M., Zyadah, M. A., Jamaan, S. A., & Mohammad, A. (2014). Cognitive and biochemical effects of monosodium glutamate and aspartame, administered individually and in combination in male albino mice. Neurotoxicology and Teratology, 42, 60-67.
Adikwu, E., Ebong, N. O., & Julius, E. (2025). Protective effect of silymarin on monosodium glutamate-induced liver toxicity in rats. Biological and Biomedical Journal, 3(1), 62-69.
Ajibola, M., Akintayo, C. O., Uzoechi, A. C., & Okere, S. (2012). The effects of orally administered monosodium glutamate (MSG) on blood thrombocyte, blood coagulation and bleeding in rats. Journal of Pharmacy and Biological Sciences, 4(1), 04-08.
Alalwani, A. D. (2014). Monosodium glutamate induced testicular lesions in rats (histological study). Middle East Fertility Society Journal, 19(4), 274-280.
Albers, J. J., Warnick, G. R., & Chenng, M. C. (1978). Quantitation of high density lipoproteins. Lipids, 13(12), 926-932.
ALhamed, T. A., Al-marzook, F. A., & Al-Asady, A. M. (2021). The harmful effects of monosodium glutamate on blood parameters liver and kidney functions in adult white rats and the protective role of Omega-3. Indian Journal of Forensic Medicine & Toxicology, 15(3), 52-50.
Alwaleedi, S. A. (2016). Adverse effects of monosodium glutamate on serum lipid profile, cholesterol status and blood glucose in adult rats. Research Journal of Pharmaceutical, Biological and Chemical Sciences, 7(1), 732-739.
Andersen, J. V., & Schousboe, A. (2023). Milestone review: metabolic dynamics of glutamate and GABAmediated neurotransmission—the essential roles of astrocytes. Journal of Neurochemistry, 166(2), 109-137.
Banerjee, A., Das, D., Paul, R., Roy, S., Das, U., Saha, S., Dey, S., Adhikary, A., Mukherjee, S., & Maji, B. K. (2020). Mechanistic study of attenuation of monosodium glutamate mixed high lipid diet induced systemic damage in rats by Coccinia grandis. Scientific Reports, 10(1), 15443.
Banerjee, A., Mukherjee, S., & Maji, B. K. (2021). Worldwide flavor enhancer monosodium glutamate combined with high lipid diet provokes metabolic alterations and systemic anomalies: an overview. Toxicology Reports, 8, 938-961.
Bannai, M., & Torii, K. (2013). Digestive physiology of the pig symposium: detection of dietary glutamate via gut–brain axis. Journal of Animal Science, 91(5), 1974-1981.
Bayram, H. M., Akgöz, H. F., Kızıldemir, Ö., & Öztürkcan, S. A. (2023). Monosodium glutamate: review on preclinical and clinical reports. Biointerface Research in Applied Chemistry, 13(2), 149.
Bevzo, V. V. (2024). Effect of Long-Term administration of monosodium glutamate on bodyweight of rats and some indices of lipid metabolism. Сlinical and Experimental Pathology, 23(87), 49-52.
Bevzo, V. V. (2025). The effect of prolonged administration of sodium glutamate on certain indicators of lipid metabolism and development of obesity in rats. Current Problems of Modern Medicine, 25(1), 107-111.
Bou Zerdan, M., Moussa, S., Atoui, A., & Assi, H. I. (2021). Mechanisms of immunotoxicity: stressors and evaluators. International Journal of Molecular Sciences, 22(15), 8242.
Cakmakci, S., & Salik, M. A. (2022). Monosodium glutamate (MSG) as a food additive and comments on its use. 4th International Conference on Advanced Engineering Technologies (pp. 289-295). At: Turkey, Bayburt.
Evbuomwan, S. A., Omotosho, O., & Akinola, O. (2023). Monosodium glutamate: health risks, controversies and future perspectives. Agrociencia, 57(6), 26-54.
Farhat, F., Nofal, S., Eman M., Raafat, E. M., & Ahmed, A. A. E. (2021). Monosodium glutamate safety, neurotoxicity and some recent studies. Al-Azhar Journal of Pharmaceutical Sciences, 64(2), 222-243.
Gbore, F. A., Olubu, R., O., Irewole M., Aworetan, Ruth A. O., & Gabriel, A. (2016). Oral administration of monosodium glutamate alters growth and blood parameters in female rabbits. European Journal of Biological Research, 6(3), 218-225.
Ghadhban, R. F. (2017). Effects of monosodium glutamate on some hematological parameters in adult rats. Indian Journal of Applied Research, 7(2), 689-690.
Gruenbaum, B. F., Schonwald, A., Boyko, M., & Zlotnik, A. (2024). The role of glutamate and blood–brain barrier disruption as a mechanistic link between epilepsy and depression. Cells, 13(14), 1228.
Hawkins, R. A., & Viña, J. R. (2016). How glutamate is managed by the blood–brain barrier. Biology, 5(4), 37-43.
Iannilli, E., Pötz, E. L., & Hummel, T. (2024). A survey on the evaluation of monosodium glutamate (MSG) taste in Austria. Foods, 14(1), 22.
Ibegbulem, C. O., Chikezie, P. C., Ukoha, A. I., & Opara, C. N. (2016). Effects of diet containing monosodium glutamate on organ weights, acute blood steroidal sex hormone levels, lipid profile and erythrocyte antioxidant enzymes activities of rats. Journal of Acute Disease, 5(5), 402-407.
Iwase, M., Setsuro, K. I., Kenji, T. I., Mototaka, Y., Kenzo, I., Noriyasu, S., & Masatoshi F. (2000). Effects of monosodium glutamate-induced obesity in spontaneously hypertensive rats vs. Wistar Kyoto rats: serum leptin and blood flow to brown adipose tissue. Hypertension Research, 23(5), 503-510.
Jasińska-Stroschein, M., & Orszulak-Michalak, D. (2021). Reporting experimental studies on animals–the problems with translating of outcomes to clinical benefits. Methodological and statistical considerations: the example of pulmonary hypertension. European Journal of Pharmacology, 897, 173952.
Jeong, S. H., Jang, J. H., Jung, D. H., Lee, G. Y., & Lee, Y. B. (2021). Pharmacokinetic changes according to single or multiple oral administrations of socheongryong-tang to rats: presented as a typical example of changes in the pharmacokinetics following multiple exposures to herbal medicines. Pharmaceutics, 13(4), 478.
Katrancı, Y., Aydemir, A., Kızılkaya, B., Baştemur, G. Y., & Ozkorucuklu, S. P. (2024). Investigation of monosodium glutamate content in flavors, seasonings, and sauces from local markets in Turkey. Food Science & Nutrition, 12(10), 7806-7813.
Kayode, O. T., Bello, J. A., Oguntola, J. A., Kayode, A. A., & Olukoya, D. K. (2023). The interplay between monosodium glutamate (MSG) consumption and metabolic disorders. Heliyon, 9(9), e19675.
Klbik, I. (2024). Is post-hypertonic lysis of human red blood cells caused by excessive cell volume regulation? Cryobiology, 114, 104795.
Kumari, D., Kumar, R., Sharma, A. K., Thakur, K., Mahajan, D., Kumari, H., & Pankaj, P. P. (2023). Physiological effects of Monosodium Glutamate –a food additive on human health: a review. Journal of Experimental Zoology India, 26(2), 2461-2466.
Lins, U. M., Oliveira, V. B., Souza, A. F., Rodriguez, D. M., Dantas, S. S., Lima, M. A., Andrade, R. F., & Campos-Takaki, G. M. (2022). HMG-CoA reductase inhibitors: an updated review of biosynthesis and patent prospecting. Research, Society and Development, 11(14), e508111436186-e508111436186.
Ogunmokunwa, A. E., & Ibitoye, B. O. (2025). Monosodium glutamate (MSG) exposure induced oxidative stress and disrupted testicular hormonal regulation, exacerbating reproductive dysfunction in male WISTAR rats. Endocrine and Metabolic Science, 17, 100226.
Pakpahan, P., & Edianto, D. (2021). Effects of monosodium glutamate on the weight gain of experimental rats. Journal of Endocrinology, Tropical Medicine, and Infectious Disease (JETROMI), 3(3), 110-114.
Parekh, D. S., Eaton, W. A., & Thein, S. L. (2024). Recent developments in the use of pyruvate kinase activators as a new approach for treating sickle cell disease. Blood, 143(10), 866-871.
Rahayu, M. S., & Wahyuni, S. (2021). Effects of oral administration of monosodium glutamate (MSG) on obesity in male wistar rats (Rattus norvegicus). Bioscientia Medicina: Journal of Biomedicine and Translational Research, 5(9), 879-882.
Rajendran, M. S., Madathil, S. R., Ahalliya, R. M., Kannappan, P., Raju, M. V., & Chandrasekaran, M. K. (2023). Investigation of a child-equivalent dose of monosodium glutamate toxicity in Wistar rats. Journal of Excipients & Food Chemicals, 14(2), 59-70.
Recoules, C., Touvier, M., Pierre, F., & Audebert, M. (2025). Evaluation of the toxic effects of food additives, alone or in mixture, in four human cell models. Food and Chemical Toxicology, 196, 115198.
Roeschlau, P., Bernt, E., & Gruber, W. A. (1974). Enzymatic termination of total cholesterol. Clinical Biochemistry, 12(5), 226.
Rotimi, O. A., Olayiwola, I. O., Ademuyiwa, O., & Balogun, E. A. (2012). Effects of fibre-enriched diets on tissue lipid profiles of MSG obese rats. Food and Chemical Toxicology, 50(11), 4062-4067.
Shastri, M., Raval, D. M., & Rathod, V. M. (2023). Monosodium glutamate (MSG) symptom complex (Chinese restaurant syndrome): nightmare of Chinese food lovers! Journal of the Association of Physicians of India, 71(6), 95.
Shibeko, A. M., Balandina, A. N., Podoplelova, N. A., & Panteleev, M. A. (2020). Current trends in blood coagulation studies. Pediatric Hematology/Oncology and Immunopathology, 19(3), 144-150.
Tietz, N. W. (1986). Fundamentals of clinical chemistry. (3rd ed.) London, W.B.: Philadelphia. Saunders Company. p. 888
Tigner, A., Ibrahim, S. A., & Murray, I. V. (2022). Histology, white blood cell. [Updated 2022 Nov 14]. In: StatPearls [Internet]. Treasure Island (FL): Available from: https://www.ncbi.nlm.nih.gov/books/NBK563148/
Urrutia-Pereira, M., Fogelbach, G. G., Chong-Neto, H. J., & Solé, D. (2025). Food additives and their impact on human health. Allergologia et Immunopathologia, 53(2), 26-31.
Utume, L. N., Ansha, P. M., & Gav, T. A. (2020). The effects of orally administered monosodium glutamate (MSG) on the metabolic syndrome of adult albino rats. Nigerian Annals of Pure and Applied Sciences, 3(3a), 27-37.
Wang, A., Fu, Y., Fu, L., Li, M., Xu, J., Guo, X., Wu, Y., Xing, X., & Miao, S. (2024). Dietary monosodium glutamate affects the growth and feed utilization of Eriocheir sinensis by regulating the appetite related genes expression. Aquaculture Reports, 38, 102310.
Yang, L., Gao, Y., Gong, J., Peng, L., El-Seedi, H. R., Farag, M. A., Zhao, Y., & Xiao, J. (2023). A multifaceted review of monosodium glutamate effects on human health and its natural remedies. Food Materials Research, 3(1).
Zhang, L., Zhou, Y., Yang, Z., Jiang, L., Yan, X., Zhu, W., Shen, Y., Wang, B., Li, J., & Song, J. (2025). Lipid droplets in central nervous system and functional profiles of brain cells containing lipid droplets in various diseases. Journal of Neuroinflammation, 22(1), 7.