Antioxidant and Antidiabetic Effect of Biosynthesis Zinc Nanoparticles by Using Polyherbal Aqueous Extract in Wistar Rats
Derouiche Samir*, Benmoussa Ouissam, Djouadi Anfal
Abstract
The goal of this study was to see how ZnNPs (a green synthesis formulation) affected the physiological, biochemical, and oxidative stress changes generated by experimental diabetes in rats. Twenty female albino Wistar rats were randomly separated into four groups (n=5): control, zinc nanoparticles, diabetic rats, and diabetic rats treated with zinc nanoparticles. Rats were given all types of treatments orally for 21 days. Alloxan (150mg/kg) was used to make rats diabetic. Various parameters were calculated, including biochemical, hematological, and oxidative stress markers. Histopathological lesions of pancreas tissues were noticed. Characterizations of nanoparticles were analyzed using standard technics. UV-Vis Spectroscopy revealed that ZnNPs exhibit a peak at 230 nm, and SEM indicated that the produced ZnNPs are a smaller size than 21.5 nm. The FTIR spectra revealed a peak in the range of 400-700 cm-1. In vivo results revealed a change in the diabetic group's lipid profile and metabolic markers. While the liver, kidneys, and pancreas antioxidant defense systems were harmed, by increasing MDA levels and GSH levels and SOD activity are declining compared to control. Furthermore, hematological measurements demonstrated that diabetes reduced RBC, MCV, and HCT levels significantly (P<0.01). When diabetic rats' pancreas tissues were compared to control rats', histopathological examination revealed a difference. On the other hand, treating diabetic rats with ZnNPs), improved and corrected partially of the prior parameters. Finally, the utilization of ZnNPs synthesized by polyherbal extract appears to be the most important limiting factor in diabetes development and consequences.
Keywords: Diabetes, Oxidative stress, Polyherbalal, ZnNPs, Rats
Introduction
Diabetes is a major health problem and is one of the fastest-growing worldwide health crises of the twenty-first century, with frightening levels of prevalence. currently, nearly half a billion people worldwide live with diabetes, in 2030, the number is expected to climb to 578 million people., and to 700 million in 2045 (Saeedi et al., 2019). Diabetes is characterized by the severity of the complications it causes. Indeed, it is the most common cause of end-stage renal failure, blindness, and amputation of the lower limbs, it is also the sixth cause of death (Samir et al., 2017). Many recent types of research have revealed that oxidative stress is a significant influence on human metabolic and physiological changes, as well as a variety of disorders (Ouidad et al., 2021). The complication of diabetes has long been thought to be related to increased production of free radicals or impairment of antioxidant defenses causing a When the physiological equilibrium between oxidants and antioxidants is upset in favor of the oxidants, oxidative stress ensues, potentially causing damage to the organism (Pasupuleti et al., 2020). Among the chronic complications of diabetes (microvascular) nephropathy, it is a degenerative disease that by specific glomerular involvement (Barrett et al., 2017). Free radicals, often known as oxidants are atoms or molecules. that are capable of having an independent existence that includes one or more electrons that are not paired (Derouiche & Djouadi 2017; Shaheen et al., 2022). Free radicals (RL) are responsible for biological alterations, they inhibit, among other things, insulin secretion and interfere with different stages of the stimulus/secretion coupling (Stožer et al., 2021). Recently, nanotechnology has become a well-known field of research, and interest in the applications of nanotechnology in various fields has increased (Ouidad et al., 2020). This is due to its ability to promote scientific innovation while giving a great advantage to society (MubarakAli et al., 2019; Abulhamael et al., 2022; Yousefian et al., 2022). Can be noticed, with the increase in the range of applications (Leng et al., 2018). The plant-mediated or green approach to the preparation of metal particles and metal oxide has also received a great deal of consideration due to the ease of preparation and environmental friendliness of this technology when compared to physical and chemical processes, it has received a lot of attention (Derouiche et al., 2020). The use of plant extracts in the production of nanoparticles is gaining popularity in biological applications due to their unique properties (Pravallika et al., 2019). Zinc is well known as a potential mineral involved in the regulation of metabolism, in which zinc oxide nanoparticles (ZnNP) are considered to be one of the most promising and new magic materials due to their stimulating properties, and unique antimicrobials as well as their low cost and wide application in various fields (Chetehouna et al., 2020; Üzüm et al., 2022). In light of these data, this study aims to prepare the green zinc nanoparticles from the polyherbal extract and study its anti-diabetic effect in rats.
Materials and Methods
Chemicals
Zinc nitrate and all chemicals used in our study were obtained from Sigma-Aldrich (St. Louis, MA, USA). Double distilled water was used to make all of the solutions.
Plant Material
The plants used in this work are the Aquilaria malaccensis, purchased from the local market, then ground with a mixer until a fine powder. Aquilaria powder is stored at room temperature in airtight containers protected from bright light until the start of the experiment. Portulaca oleracea, harvested in the Oued Righ region (Touggourt). After the plant is restored, the plants are cleaned, and then dried out from sunlight and at room temperature. Then the dry leaves are ground. Coriandrum sativum was collected in herbal stores from herbal in local markets of the EL-Oued state. Then it's pounded into a powder and kept at room temperature until it's time to utilize it.
Methode of Zinc Oxide Nanoparticle Preparation
For the synthesis of zinc oxide nanoparticles, we first prepared an aqueous extract of polyherbal made of 50 mg Portulaca Aleracea and 25 mg for each Coriandrum sativum and Aquilaria malaccensis, and mixed it with 100 ml with distilled water and then heated it at a temperature of 60 ° C while stirring in the meantime, we add zinc nitrate 5 grams gradually with adding 2 ml of NaOH (1 M) gradually and mixing for two hours until the color of the solution becomes pale. Then it is left in the oven for 24 hours at 60 ° C. To dry, the pale white sediment was removed and washed twice with distilled water, then with ethanol to remove impurities, and it was dried in the oven at 60 °C. To remove organic residues, put it in the oven for two hours at 400 ° C, until we get a pale white powder (Ezealisiji et al., 2019).
Characterization of ZnNPs
The ZnO nanoparticles prepared by the green method were characterized using FTIR spectroscopy, UV-Vis spectrophotometer, and SEM technic. In the UV-Vis range of 200-750 nm. IR analyses were done in the Department of Process Engineering and Petrochemicals labs by direct reading. SEM analyses were performed to observe the morphology and surface topography of ZnNPs and to determine the average particle size.
Animal Care
Our study was conducted on twenty (20) Wistar Albino female rats weighing between 164 and 208 grams at the beginning of the experiment of the same age with good physiological conditions. These animals were brought from the Institut Pasteur in Algiers, and they were brought up in an animal facility at the level of the Faculty of Natural Sciences and Life at the University of EL-shahid Hamma Lakhdar El-Oued, under standard environmental conditions: at a temperature of 23 ± 2 ° C and a light period of 12 hours / 24 hours. The rats are housed in plastic cages, each cage containing four mice. These cages contain sawdust, which is changed twice every week until the end of the experiment. We weighed each mouse regularly, once a week, and measured blood sugar once a week. The animals were fed a diet prepared according to Southon et al. 2019. The research protocol was approved by the department of CMB, El Oued University Ethics Committee (approval number: 08 EC/DCMB/FNSL/EU2021).
Induction of Experimental Diabetes in Rats
Diabetes was produced in rats by injecting insulin intraperitoneally into a freshly prepared solution of Alloxan monohydrate (Sigma) at a dose of 150 mg/kg body weight after they had fasted overnight (Kiani et al., 2018). Alloxan is dissolved in a physiological solution (NaCl 0.9%). The groups of healthy rats received the same volume of buffer intraperitoneally (NaCl 0.9%). After the injection, bottles were used to replace the water containing 20% of the glucose solution on the first day and 5% of the glucose solution on the second and third days, to overcome the hypoglycemia caused by the substance Alloxan. This hypoglycemia can be fatal for rats. After 72 hours of the injection, diabetes was confirmed in the rats by measuring blood glucose using a type glucometer (Vital-Check; TECO Diagnostics, Korea). Only the rats having a blood glucose level greater than (14 mmol / l) were considered to be diabetic and retained for this experiment.
Experimental Design
After induction of diabetes, the groups were kept in the same conditions. After that, we randomly divided the animals into four groups, each one containing five rats; Group 01 (controls): control rats fed a standard diet, Group 2: healthy rats fed a standard diet and treated with zinc oxide nanoparticles, Group 3 diabetic rats fed a standard diet and Group 4: diabetic rats received a standard diet and treated with zinc oxide nanoparticles. Starting treatment with ZnNPs. It begins 72 hours after induction of diabetes. The treatment lasted a total of 20 days.
Sacrifice and Collecting Blood and Organs
At the end of treatment with ZnNPs, the animals fasted for 16 hours and then were anesthetized with chloroform (94%) by inhalation and sacrifice (by decapitation). When rats were sacrificed, blood glucose was measured during the sacrifice period. The blood was also transfused into EDTA tubes for hematology studies, then the blood obtained was centrifuged at 3000 rpm for 10 min, plasma was recovered, and then rapidly frozen at -20 ° C until use. Another amount of blood was collected in tubes without anticoagulants for biochemical analysis, and it was placed in a centrifuge at 3000 rpm for 10 minutes to obtain serum frozen at -20 ° C for use in biochemical analysis (urea, creatinine, triglycerides, cholesterol, TGO, TGP). After dissection, the (liver, pancreas, and kidneys,) are carefully removed, and adipose tissue stripped from them, and these isolated organs are weighed and rinsed in a 0.9% NaCl solution. Organ congeners are prepared for the detection of oxidative stress factors (Malondialdehyde (MDA), Superoxide dismutase (SOD), and Reduced Glutathione (GSH). The pancreas portion of each rat from each cohort is placed in a formal solution, for preservation and use of tissue sections.
Biochemical, Hematological, and Oxidative Stress Parameters
Biochemical parameters were evaluated using an auto-analyzer and commercial reagent kits from Biomaghreb (Tunisia). The parameters of hematology were obtained using a fully automated blood cell counter (ERMA). The levels of malondialdehyde in rat tissue homogenates were determined by the thiobarbituric acid method as described in the method of Yagi 1976. The amount of reduced glutathione in tissues was determined according to the method of Weckbecker and Cory, 1988. The assay method of SOD activity using the NBT reagent according to the method of Beauchamp and Fridovich 1971.
Determination of Liver Glycogen Level
Mix the homogenate with 4% trichloroacetic acid (v/v). For 10 minutes, centrifuge at 3000 rpm. Take the supernatant and put it aside. The colorimetric approach is used to determine the amount of glycogen in the tissues. 1 ml anthrone reagent (150 mg Anthrone + 75 ml concentrated sulfuric acid + 25 ml distilled water) is added to 25µ l homogenate, then the mixture is immersed in a water bath at 800 °C for 10 minutes. The intensity of the green color is related to the carbohydrate content of the sample. Reading the optical density of distilled water against a reagent blank at = 620 nm. The value of absorbance is calculated. and then converted to carbohydrate concentration equivalent using an established calibration curve, with glucose (0.1-1 mg/ml), under the same experimental condition (Jean & Marie, 1975).
Histopathological Study
After the rats were sacrificed, the pancreas was extracted and submerged in a fixative solution (4% formaldehyde in phosphate buffer, pH=7.6) for 48 hours before being dried in a graded series of ethanol, washed with toluene, embedded in paraffin, and stained with hematoxylin and eosin. The histology was examined using a light microscope.
Statistical Analysis
The percentages or averages of the results were used to express the results (standard deviation). The Student's T-test was performed to compare independent samples. Minitab 13.0 was used to analyze all of the data in this study. A statistically significant difference is shown by P < 0.05.
Results and Discussion
Characterization of ZnNPs
UV–Vis and FTIR Spectroscopy
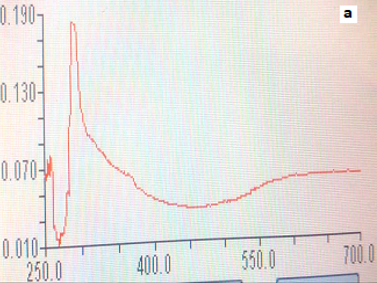
UV–Vis absorption of green synthesis of ZnNPs is shown in (Figure 1a). The presence of a peak at 300 nm corresponds to the formation of the ZnO compound. Figure 1b observed that the presence peak in the range 400-500 cm-1 corresponds to the O-Zn, compound which confirmed the biosynthesis of nanoparticles of zinc.
|
|
|
a) |
|
|
|
b) |
|
Figure 1. Uv-Vis and FTIR spectrum of ZnNPs. |
SEM with Energy Dispersive X-Ray Analysis
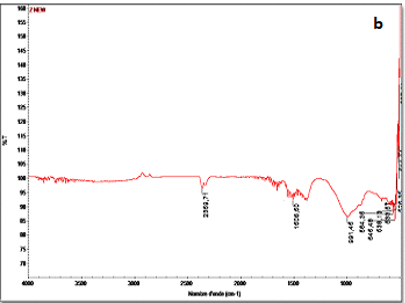
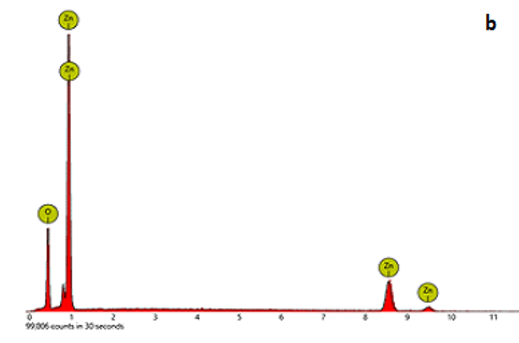
SEM analyses were used to determine the form, structure, and size of the produced ZNPs (Figure 2a). Micrographs of ZNPs nanoparticles powder taken with a polyherbal aqueous extract revealed that they possessed a nano-sized range, a spherical shape, and a homogeneous distribution. The nanoparticles in our study were 21.39nm in size. Figure 2b shows the elemental composition analyses of the ZNPs based on the EDX plot of the SEM images. The excellent purity of the produced ZNPs was also validated by energy-dispersive X-ray spectroscopy (EDX). The anticipated stoichiometric mass percentages of Zn and O are 85.37 percent and 14.63 percent, respectively, according to theory.
|
|
|
a) |
|
|
|
b) |
|
Figure 2. SEM micrographs and EDX analyses of ZnO nanoparticles |
Study of Body Growth and the Relative Weight of Organs
The results presented in Table 1 show a remarkable change in weight in diabetic rats compared to the control and in the treated group compared to diabetic rats. The results obtained for relative organ weights show a highly significant increase (P˂0.01) in the relative weight of the liver, kidneys, pancreas, and ovary in the diabetic groups compared to the control group. On the other hand, the treatment with ZnNPs has an ameliorating effect (P˂0.05) on the relative weight of some tissues studied and no effect on others compared to diabetic rats.
Table 1. Bodyweight and relative organ weights in control and experimental groups
|
Parameters |
Control (n=5) |
ZnNPs (n=5) |
Diabetic (n=5) |
D+ZnNPs (n=5) |
|
|
Initial body weight (g) |
186.75±9.84 |
183±2.93** |
200±25.51 |
177±8.32*c |
|
|
body weight gain (g) |
0.42±0.043 |
0.41±0.021 |
0.19±0.012** |
0.27±0.06**c |
|
|
Relative organ weighs (%) |
Liver |
2.68±0.20 |
2.76±0.10 |
3.49±0.17** |
3.01±0.58a |
|
Kidneys |
0.52±0.02 |
0.56±0.04 |
0.79±0.20** |
0.62±0.06**c |
|
|
Pancreas |
0.33±0.03 |
0.36±0.04 |
0.41±0.11** |
0.37±0.08 |
|
Values are mean ± SEM. * p<0.05, ** p<0.01, *** p<0.001: significantly different from control group. a p<0.05, c p<0.001: significantly different from Exp diabetic group.
Biochemical Parameters
In Table 2, the results show a high increase in blood glucose, total cholesterol, triglycerides, creatinine, and urea levels and a decrease in liver glycogen level in the diabetic group compared to the control. Moreover, a significant amélioration of these markers in D+ZnNPs groups compared to the diabetic group. Results of transaminases enzymes activities appeared an increase significantly in GPT but not in GOT activity in the diabetic group as compared to the control. In addition, no significant change in the level of GPT and GOT activities in D+ZnNPs as compared to the diabetic group.
Table 2. Biochemical markers levels of control and experimental groups
|
paramètre |
Control (n=5) |
ZnNPs (n=5) |
Diabetic (n=5) |
D+ZnNPs (n=5) |
|
Blood glucose (mg/100ml) |
122.7±3.5 |
142.2±2.51 |
317.62±7.21** |
262.87±8.36**c |
|
Liver glycogen (µg/g tissues) |
1.85±0.034 |
1.79±0.025 |
0.21±0.018*** |
2.91±0.092*c |
|
Urea (g/l) |
0.38±0.04 |
0.46±0.03*** |
0.79±0.25** |
0.47±0.11c |
|
Creatinine (mg/l) |
7.15±0.65 |
5.07±0.96*** |
8.35±1.53* |
6.57±0.51*c |
|
Cholesterol (g/l) |
0.71±0.24 |
0.81±0.15 |
0.98±0.30** |
0.61±0.19c |
|
Triglyceride (g/l) |
0.43±0.12 |
0.41±0.03 |
0.87±0.38* |
0.57±0.16*b |
|
GOT (UI/l) |
44.3±32.5 |
132±20.10 |
34.25±16.79 |
33.3±33b |
|
GPT (UI/l) |
38.50±12.29 |
42.75±19.16 |
50.25±9.72** |
54.75±15.85** |
Values are mean ± SEM. * p<0.05, ** p<0.01, *** p<0.001: significantly different from control group. a p<0.05, c p<0.001: significantly different from Exp diabetic group.
Hematological Markers
Concerning erythrocyte and leukocyte line markers, our results in Table 3 showed a very high significant decrease (P˂0.001) in Red blood cell (RBC), Mean corpuscular volume (MCV), and a highly significant decrease (P˂0.01) in hematocrit (HCT) percentage and no significant change (P>0.05) in White blood cell (WBC), Lymphocyte (LYM), PLT, and Hemoglobin (HGB), in the diabetic group as compared to the controls. On the other hand, there was a very highly significant (p < 0.001) decrease in WBC and LYM values and a significant (p < 0.05) increase in RBC, HCT, and MCV levels in the D+ZnNPs group compared to the diabetic group.
Table 3. Leukocyte and Erythrocyte line markers level in control and experimental groups.
|
Parameter |
Control (n=5) |
ZnNPs (n=5) |
Diabetic (n=5) |
D+ZnNPs (n=5) |
|
WBC (103/ul) |
4.22±1.24 |
4.67±0.82 |
4.57±0.97 |
2.95±0.93**b |
|
LYM (103/ul) |
3.40±0.97 |
3.40±0.77*** |
3.10±0.82 |
2.22±0.59**b |
|
HGB (g/dl) |
11.85±1.26 |
11.65±1.26 |
11.82±1.15 |
11.32±2.43 |
|
RBC (106/ul) |
6.52±0.41 |
6.23±0.44 |
5.63±0.21*** |
6.09±1.19a |
|
MCV(fl) |
55.02±1.38 |
48.45±1.73*** |
48.12±0.90*** |
55.32±2.43c |
|
HCT (%) |
34.67±3.92 |
28.78±3.56** |
29.65±2.64** |
34±7.83a |
|
Platelet (103/ul) |
713.7±133.6 |
564.5±85.9** |
671.8±109.9 |
499.5±97.0***b |
Values are mean ± SEM. * p<0.05, ** p<0.01, *** p<0.001: significantly different from control group. a p<0.05, c p<0.001: significantly different from Exp diabetic group.
Oxidative Stress Parameters
Malondialdehyde (MDA) Concentration
There was a significant increase in MDA level in the diabetic group in the liver (P<0.001), kidney (P<0.01), and pancreas (P<0.001) organs and a very low variation of all tissues studies in ZnNPs groups in comparison to control group, as our results have shown in Table 4. In addition as compared to diabetic rats, a significant decrease (P<0.001) in MDA level in most tissue studies was observed in D+ZnNPs groups. Regarding GSH results, as compared to the control there was a significant decrease (P<0.001) in GSH levels in all tissues of diabetic groups compared to the control rats group. Furthermore, the tissue GSH concentration of different treatments groups was significantly increased as compared to the diabetic rats. The results of SOD activity showed a significant decrease (P<0.001) of SOD activities in the liver, kidney, and pancreas in diabetic animals as compared to the control. As well, the treatment by ZnNPs induces a significant amelioration (P<0.001) in all tissues SOD activities in comparison to diabetic rats.
Table 4. Oxidative stress parameters levels in control and experimental groups.
|
Parameters |
Control (n=5) |
ZnNPs (n=5) |
Diabetic (n=5) |
D+ZnNPs (n=5) |
|
|
MDA (nmol/g tissue) |
Liver |
15.81±0.67 |
27.06±2.46 |
54.66±8.37*** |
22.07±1.23*c |
|
Kidneys |
24.41±0.04 |
22.50±0.16*** |
38.33±3.03** |
22.33±2.52c |
|
|
Pancreas |
16.08±5.88 |
13.69±2.25* |
27.71±1.21*** |
20.54±5.92c |
|
|
GSH (nmol/g tissue) |
Liver |
3.64±0.25 |
3.05±0.20 |
2.88±1.24* |
5.65±1.19** |
|
Kidneys |
8.94±0.57 |
8.76±1.54 |
7.88±0.17*** |
9.61±1.04b |
|
|
Pancreas |
7.98±3.71 |
8.33±2.50 |
2.79±0.41*** |
5.90±0.88***c |
|
|
SOD (UI/g tissue) |
Liver |
15.95±0.74 |
11.44±0.55*** |
13.29±1.49** |
14.91±0.29***c |
|
Kidneys |
13.29±0.054 |
12.32±0.1.08* |
12.15±0.55*** |
13.66±0.24**c |
|
|
Pancreas |
14.03±3.67 |
12.76±2.36 |
11.46±0.72*** |
14.80±0.47*c |
|
Values are mean ± SEM, * p<0.05, ** p<0.01, *** p<0.001: significantly different from control group. a p<0.05, c p<0.001: significantly different from Exp diabetic group.
Histological Analysis
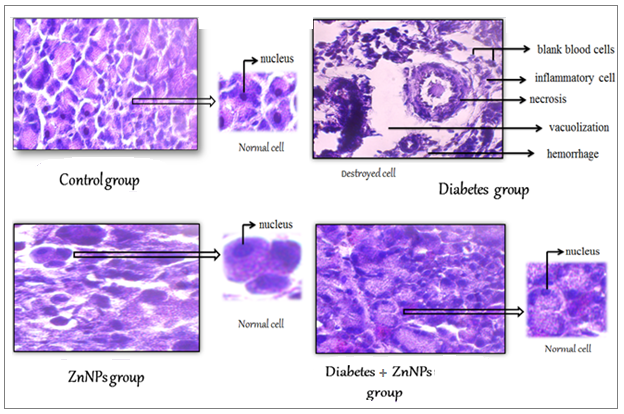
Completed the histopathological studies to determine the severity of diabetes and anti-diabetic effects of zinc nanoparticles (Figure 3). Microscopic examination of the pancreas tissues represents the normal histological structure in the control while a massive alteration from hemorrhagic, inflammatory, vacualisation, and necrosis in the pancreas tissue structure of diabetic rats. Furthermore, the treatment by ZnNPs improved the ameliorative effect of these histological alterations which have a similar structure to the control.
|
|
|
Figure 3. Photomicrograph of the pancreas tissues of control and experimental group (×40).
|
The results indicate that ZnNPs samples absorb the radiation at 230 nm. Contrary to Alotaibi et al. 2022 an appeared pic in 298 nm. From the FTIR spectrums, the peak of ZnNPs presented in the range of 400-700 cm-1, as reported by Saeed et al. (2021). Scanning electron microscopy image and EDX spectra of the biosynthesized ZnO nanoparticles demonstrated that the requisite phases of Zn and O are present in the samples and that the produced material is of high purity ZnNPs and also it has a size relatively less than 21.5 nm, while the ZnO nanoparticle synthesized using Fumaria officinalis leaf with size 27.96 nm (Zou et al., 2021). Regarding the relative weights of the organs, we notice kidney, hepatic, and pancreatic hypertrophy. This increase in relative organ weight may be due to Alloxan-induced necrosis and apoptosis (Novoselova et al., 2020). For the therapeutic effect of zinc oxide nanoparticles. Noticing an improvement in relative (Zou et al., 2021) weights due to their size, morphology, and porosity will allow multifunctional power with its application in different areas. Metal nanoparticles are considered safe for applications because they are more stable and have essential properties. Because it can serve as a useful catalyst for the reduction or elimination of toxic chemicals (Yaqoob et al., 2020), which eliminates the alloxan effect responsible for tissue hypertrophy. On the other hand, we found that the treatment by zinc nanoform for 21 days could play a crucial role in lowering serum glucose, triglyceride, and cholesterol levels in diabetic rats. Because zinc can potentiate insulin, which promotes glucose transport, it may help improve peripheral insulin sensitivity (Derouiche & Kechrid, 2018). Zinc also inhibits glucose production and absorption while boosting glucose metabolism and storage. This happens mostly because important enzymes involved in certain metabolic activities, including alpha-glucosidase, phosphofructokinase (PFK), phosphokinase (PK), and glycogen synthase, have increased activity (Derouiche et al., 2017). The results show an increase in serum urea and creatinine concentration in diabetic rats compared to the control. In the diabetic state, hyperglycemia leads to kidney damage which in turn leads to poor renal filtration of urea and creatinine. Poor filtration leads to a rise in urea and creatinine levels in the blood (Pandya et al., 2016; Almohmmadi et al., 2022). This can be explained by the accelerated degradation of hepatic and plasma proteins or the degradation of certain body protein compounds by proteolysis due to the administration of alloxan or of food compounds which can be degraded into amino acids and then into urea (Zhou et al., 2017). The decrease in renal parameters rate after administration of Zinc Oxide nanoparticles this explained by their protective effect. ZnO-NPS is a non-toxic element it has an antioxidant capacity that prevents or slows down oxidation by neutralizing free radicals, thus improving the functioning power of the tissue to stop the disruption of the cell membrane (Sharifi-Rad et al., 2020). The results show a significant increase in serum GPT activity in the diabetic group compared to the control group. This is explained by the destruction of hepatic cells (hepatic cytolysis) by toxic substances (hepato-toxic effect of alloxan) (Maroua et al., 2018). In addition, the increase in transaminases is explained by the accumulation of amino acids such as alanine and glutamic acid in the blood resulting from the breakdown of proteins in the body. Thus, under the action of transaminases, these amino acids can be transformed into carboxylic compounds such as α keto-glutamic acid and pyruvic acid and then into glucose, which reflects the strong enzymatic activity of transaminases (Pollegioni et al., 2020). Zinc treatment results in a correction of plasma transaminases activities, which could be attributed to the anti-free radical / anti-oxidant and chelating efficacy of the metals of this element (Coni et al., 2021) and stabilization of the cell membrane. Consequently, zinc has a hepatoprotective effect in various toxic conditions. These findings are consistent with those of earlier research that has suggested that zinc has a positive effect on histological and enzymatic alterations in rats (Kataba et al., 2021). Regarding the results of the hematological study, our results showed a decrease in the number of red blood cells, hematocrit, and mean globular volume in the diabetic rats against the control rats which signifies hematotoxicity revealed by anemia due to the toxicity of the blood cells. Cotoraci et al., (2021) During diabetes, numerous hematological parameters and the immune system were observed to be affected. Non-enzymatic glycosylation of RBC membrane proteins has risen which coincides with hyperglycemia and has been linked to anemia in diabetes mellitus (Lapić et al., 2022). In diabetes mellitus, oxidation of these proteins and hyperglycemia produce a rise in the formation of lipid peroxides, which leads to RBC hemolysis (Kosmachevskaya et al., 2021). Thus, the results obtained show that the treatment with ZnNPs in diabetic rats induced an improvement in the hematological parameters. Moreover, Zinc signal activation of RBC production appears to be prevalent in several mammals. However, the zinc concentration for maximum activation of RBCs in rats, zinc is a strong signal for common carp to stimulate erythropoiesis which explains this improvement (Chen et al., 2017). Regarding the oxidative stress parameters, the results obtained show a decrease in GSH concentration and SOD activity and an increase in MDA level in diabetic rats compared to the control. Hyperglycemia associated with diabetes is a limiting factor for oxidative stress. In diabetes, when the glucose level increases, the hexokinase is then saturated and the excess glucose is partly metabolized via the polyol pathway in the insulin-independent tissues. Glucose is converted to sorbitol by aldose reductase. using as a cofactor NADPH, H+ coming from the pentose-phosphate pathway and which will be oxidized to NADP+. The expression of this enzyme appears to be increased in diabetes (Tang et al., 2012). Oxidation of lipids makes membranes more rigid and therefore less fluid (Casares et al, 2019). The increase in MDA is involved in the modification of -glutamylcysteinesynthetas (-GCS), the enzyme that plays a role in glutathione synthesis (Lu, 2009). The treatment of diabetic rats with ZnNPs improves antioxidant activity. Zinc is an essential metal playing an essential role in the defense against oxidative stress. All antioxidant enzymes require a cofactor to maintain their catalytic activity. Thus, mitochondrial SOD needs manganese but cytosolic SOD requires copper and zinc for their activity (Wang et al., 2018). The mechanism of what could be the ZnNPs enter the target cells, dissociate, and release Zn+2 ions slowly but consistently (Siddiqi et al., 2018). Zn is a well-known antioxidant metal; it is a key component of antioxidant enzymes such as SOD and is a well-known sulfhydryl group protector (Šulinskienė et al., 2019). Antioxidant activity is then used to detoxify free radicals.
These proteins protect cells from the harmful effects of reactive oxygen species (ROS) (Anfal & Samir, 2017). Histopathologic study of the pancreas from diabetic rats showed almost destruction of B cells due to Alloxan. This is due to Alloxan's cytotoxic action, which acts as a relative enzymatic inhibitor with unfavorable repercussions for pancreatic exocrine secretion, which is accompanied by usual diabetes due to insulin secretion failure (Lzahrani et al., 2021). pancreas in histological sections of diabetic rats treated with ZnNPs shows the presence of the islands of Langerhans better delimited with very little cell necrosis. The presence of an improvement in pancreatic tissues in rats treated with ZnNPs indicates the effectiveness of zinc oxide in protecting pancreatic tissues from damage, which improves the rate of insulin secretion and reduces the metabolic damage caused by diabetes (Maret, 2017).
Conclusion
The current study found that ZnNPs can reduce blood glucose levels in diabetics, as well as have an antioxidant and protective effect on pancreatic -cells, which improves lipid metabolism and diabetes complications.
Acknowledgments: This work was supported by the research project D01N01UN390120210002 funded by the ministry of higher education, Algeria.
Conflict of interest: None
Financial support: None
Ethics statement: The research protocol was approved by the department of cellular and molecular biology, El Oued University Ethics Committee (approval number: 08 EC/DCMB/FNSL/EU2021).
Abulhamael, A., Lim, D., Chiang, K., Alghamdi, F., & Roges, R. (2022). The prevalence of cases with apical sealer extrusion published in recent articles of the endodontic literature. Annals of Dental Specialty, 10(1), 62-64. doi:10.51847/2IbOT5bD4r
Almohmmadi, G. T., Bamagos, M. J., Al-Rashdi, Y. J. R., Alotaibi, N. S., Alkiyadi, A. A., Alzahrani, A. M., Alotaibi, H. R., Alenazi, N. F. N., Alqissom, M. A., & Alrefaei, K. I. (2022). Literature review on polycythemia vera diagnostic and management approach. World Journal of Environmental Biosciences, 11(1), 9-12. doi:10.51847/ipOt4R1qlz
Alotaibi, B., Negm, W. A., Elekhnawy, E., El-Masry, T. A., Elharty, M. E., Saleh, A., Abdelkader, D. H., & Mokhtar, F. A. (2022). Antibacterial activity of nano zinc oxide green-synthesised from Gardenia thailandica triveng. Leaves against Pseudomonas aeruginosa clinical isolates: in vitro and in vivo study. Artificial Cells, Nanomedicine, and Biotechnology, 50(1), 96-106.
Anfal, D., & Samir, D. (2017). Study of fluoride-induced haematological alterations and liver oxidative stress in rats. World Journal of Pharmacy and Pharmaceutical Sciences, 6(5), 211-221.
Barrett, E. J., Liu, Z., Khamaisi, M., King, G. L., Klein, R., Klein, B. E., Hughes, T. M., Craft, S., Freedman, B. I., Bowden, D. W., et al. (2017). Diabetic microvascular disease: an endocrine society scientific statement. The Journal of Clinical Endocrinology & Metabolism, 102(12), 4343-4410.
Beauchamp, C., & Fridovich, I. (1971). Superoxide dismutase: improved assays and an assay applicable to acrylamide gels. Analytical Biochemistry, 44(1), 276-287.
Casares, D., Escribá, P. V., & Rosselló, C. A. (2019). Membrane lipid composition: Effect on membrane and organelle structure, function and compartmentalization and therapeutic avenues. International Journal of Molecular Sciences, 20(9), 2167.
Chen, Y. H., Shiu, J. R., Ho, C. L., & Jeng, S. S. (2017). Zinc as a signal to stimulate red blood cell formation in fish. International Journal of Molecular Sciences, 18(1), 138.
Chetehouna, S., Atoussi, O., & Derouiche, S. (2020). Biological Activity and Toxicological Profile of Zinc Oxide Nanoparticles Synthesized by Portulaca oleracea (L) Leaves Extract. Advances in Nanomedicine and Nanotechnology Research, 2(2), 125-133.
Coni, P., Pichiri, G., Lachowicz, J. I., Ravarino, A., Ledda, F., Fanni, D., Gerosa, C., Piras, M., Coghe, F., Gibo, Y., et al. (2021). Zinc as a drug for wilson’s disease, non-alcoholic liver disease and covid-19-related liver injury. Molecules, 26(21), 6614.
Cotoraci, C., Ciceu, A., Sasu, A., & Hermenean, A. (2021). Natural Antioxidants in Anemia Treatment. International Journal of Molecular Sciences, 22(4), 1883.
Derouiche, S., & Djouadi, A. (2017). An evaluation of stress oxidative and serum electrolytes in female hypothyroid patients. International Journal of Biological & Medical Research, 8(1), 5861-5865.
Derouiche, S., & Kechrid, Z. (2018). Zinc Supplementation Attenuated Calcium-High Diet Effect on Zinc Status and Carbohydrate Metabolism of Non-Diabetic and Diabetic Rats. International Journal of Diabetes and Clinical Research, 5(4), 095.
Derouiche, S., Djermoun, M., & Abbas, K. (2017). Beneficial Effect of Zinc on diabetes induced kidney damage and liver stress oxidative in rats. Journal of Advances in Biology, 10(1), 2050-5055.
Derouiche, S., Guemari, I. Y., & Boulaares, I. (2020). Characterization and acute toxicity evaluation of the MgO Nanoparticles Synthesized from Aqueous Leaf Extract of Ocimum basilicum L. Algerian Journal of Biosciences, 1(1), 1-6.
Ezealisiji, K. M., Siwe-Noundou, X., Maduelosi, B., Nwachukwu, N., & Krause, R. W. M. (2019). Green synthesis of zinc oxide nanoparticles using Solanum torvum (L) leaf extract and evaluation of the toxicological profile of the ZnO nanoparticles–hydrogel composite in Wistar albino rats. International Nano Letters, 9(2), 99-107.
Jean, M. V. & Marie, F. S. (1975). Determination of liver glycogen on epon sections Quantitative evaluation of liver glycogen by histphotomeetri, on semi-thin sections of tissue included in the epon. Acta Histochem. 9(1), 11.
Kataba, A., Nakayama, S., Yohannes, Y. B., Toyomaki, H., Nakata, H., Ikenaka, Y., & Ishizuka, M. (2021). Effects of zinc on tissue uptake and toxicity of lead in Sprague Dawley rat. Journal of Veterinary Medical Science, 83(11), 1674-1685.
Kiani, A. A., Ezatpour, B., Niazi, M., & Jahanbakhsh, S. (2018). Toxicity effect of Nectaroscordum tripedale extract on hematological and biochemical parameters in mice. Entomology and Applied Science Letters, 5(2), 22-25.
Kosmachevskaya, O. V., Novikova, N. N., & Topunov, A. F. (2021). Carbonyl stress in red blood cells and hemoglobin. Antioxidants, 10(2), 253.
Lapić, I., Rogić, D., Nikolac Gabaj, N., Kajić, K., Peran, N., Surjan, L., Đuras, A., Cesar Kocijan, V., Bilopavlović, N., Smaić, F., et al. (2022). Haemoglobin A1c-based screening for prediabetes and diabetes mellitus: a multi-center study in Croatian adult population. Biochemia Medica, 32(1), 64-69.
Leng, F., Liu, F., Yang, Y., Wu, Y., & Tian, W. (2018). Strategies on nanodiagnostics and nanotherapies of the three common cancers. Nanomaterials, 8(4), 202.
Lu, S. C. (2009). Regulation of glutathione synthesis. Molecular Aspects of Medicine, 30(1-2), 42-59.
Lzahrani, A. A, Almalki, A. A. S., Almalki, K. A., Alzahrani, M. A., Alsubhi, Z. D., & Alqurashi R. M. (2021). An Overview on Diabetic Septic Foot: Clinical Features and Diagnostic Approach. International Journal of Pharmaceutical Research and Allied Sciences, 10(4), 89-94.
Maret, W. (2017). Zinc in pancreatic islet biology, insulin sensitivity, and diabetes. Preventive Nutrition and Food Science, 22(1), 1-8.
Maroua, Z., Iman, S., Zineb, M., & Samir, D. (2018). Evaluation of in-vitro Antioxidant and Anti-diabetic activities of leave aqueous extracts of Oudneya Africana. World Journal of Pharmaceutical Sciences, 6(5), 48-53.
MubarakAli, D., Manzoor, M. A., Sabarinathan, A., Devi, C. A., Rekha, P. D., Thajuddin, N., & Lee, S. Y. (2019). An investigation of antibiofilm and cytotoxic property of MgO nanoparticles. Biocatalysis and Agricultural Biotechnology, 18, 1-7.
Novoselova, E. G., Glushkova, O. V., Lunin, S. M., Khrenov, M. O., Parfenyuk, S. B., Novoselova, T. V., Sharapov, M. G., Novoselov, V. I., & Fesenko, E. E. (2020). Peroxiredoxin 6 attenuates alloxan-induced type 1 diabetes mellitus in mice and cytokine-induced cytotoxicity in RIN-m5F Beta cells. Journal of Diabetes Research, 2020.
Ouidad, A., Sara, C., & Samir, D. (2020). Biological properties and Acute Toxicity Study of Copper oxide nanoparticles prepared by aqueous leaves extract of Portulaca oleracea (L). Asian Journal of Pharmaceutical Research, 10(2), 89-94.
Ouidad, A., Sara, C., Islam, B., Yousra, G. I., & Samir, D. (2021). Analysis of blood pressure, lipid profile and hematological biomarkers in men addicted to tobacco chewing. Research Journal of Pharmacology and Pharmacodynamics, 13(1), 1-4.
Pandya, D., Nagrajappa, A. K., & Ravi, K. S. (2016). Assessment and correlation of urea and creatinine levels in saliva and serum of patients with chronic kidney disease, diabetes and hypertension–a research study. Journal of Clinical and Diagnostic Research, 10(10), ZC58-ZC62
Pasupuleti, V. R., Arigela, C. S., Gan, S. H., Salam, S. K. N., Krishnan, K. T., Rahman, N. A., & Jeffree, M. S. (2020). A review on oxidative stress, diabetic complications, and the roles of honey polyphenols. Oxidative Medicine and Cellular Longevity, 2020, 8878172.
Pollegioni, L., Rosini, E., & Molla, G. (2020). Advances in enzymatic synthesis of D-amino acids. International Journal of Molecular Sciences, 21(9), 3206.
Pravallika, P. L., Mohan, G. K., Rao, K. V., & Shanker, K. (2019). Biosynthesis, characterization and acute oral toxicity studies of synthesized iron oxide nanoparticles using ethanolic extract of Centella asiatica plant. Materials Letters, 236, 256-259.
Saeed, F., Younas, M., Fazal, H., Mushtaq, S., Rahman, F. U., Shah, M., Anjum, S., Ahmad, N., Ali, M., Hano, C., et al. (2021). Green and chemically synthesized zinc oxide nanoparticles: Effects on in-vitro seedlings and callus cultures of Silybum marianum and evaluation of their antimicrobial and anticancer potential. Artificial Cells, Nanomedicine, and Biotechnology, 49(1), 450-460.
Saeedi, P., Petersohn, I., Salpea, P., Malanda, B., Karuranga, S., Unwin, N., & IDF Diabetes Atlas Committee. (2019). Global and regional diabetes prevalence estimates for 2019 and projections for 2030 and 2045: Results from the International Diabetes Federation Diabetes Atlas. Diabetes Research and Clinical Practice, 157, 107843. doi:10.1016/j. diabres.2019.107843.
Samir, D., Kaouther, A., & Manal, D. (2017). Polysaccharides and ascorbic acid content and the effect of aqueous extract of Portulaca oleracea in high fat diet-induced obesity, dyslipidemia, and liver damage in albino Wistar rats. Algerian J Arid Environment, 7(2), 16-26.
Shaheen, R. S., Alsaffan, A. D., Al-Dusari, R. S., Helmi, R. N., & Baseer, M. A. (2022). Self-perceived oral hygiene and periodontal health among dental and medical students, dentists and physicians in KSA. Annals of Dental Specialty, 10(1), 126-132. doi:10.51847/NVcZEJ0YBV
Sharifi-Rad, M., Anil Kumar, N. V., Zucca, P., Varoni, E. M., Dini, L., Panzarini, E., Rajkovic, J., Tsouh Fokou, P. V., Azzini, E., Peluso, I., et al. (2020). Lifestyle, oxidative stress, and antioxidants: back and forth in the pathophysiology of chronic diseases. Frontiers in Physiology, 11, 694.
Siddiqi, K. S., ur Rahman, A., & Husen, A. (2018). Properties of zinc oxide nanoparticles and their activity against microbes. Nanoscale Research Letters, 13(1), 141.
Southon, S., Gee, J. M., & Johnson, I. T. (1984). Hexose transport and mucosal morphology in the small intestine of the zinc-deficient rat. British Journal of Nutrition, 52(2), 371-380.
Stožer, A., Paradiž Leitgeb, E., Pohorec, V., Dolenšek, J., Križančić Bombek, L., Gosak, M., & Skelin Klemen, M. (2021). The Role of cAMP in Beta Cell Stimulus–Secretion and Intercellular Coupling. Cells, 10(7), 1658.
Šulinskienė, J., Bernotienė, R., Baranauskienė, D., Naginienė, R., Stanevičienė, I., Kašauskas, A., & Ivanov, L. (2019). Effect of zinc on the oxidative stress biomarkers in the brain of nickel-treated mice. Oxidative Medicine and Cellular Longevity, 2019, 8549727.
Tang, W., Martin, K. A., & Hwa, J. (2012). Aldose reductase, oxidative stress, and diabetic mellitus. Frontiers in Pharmacology, 3, 87.
Üzüm, B., Özkan, O. S., & Çakan, S. (2022). Moral disengagement, organizational broken window, person-organization fit as an antecedent: Machiavellian leadership. Journal of Organizational Behavior Research, 7(1), 29-41. doi:10.51847/54QfKceM1p
Wang, Y., Branicky, R., Noë, A., & Hekimi, S. (2018). Superoxide dismutases: Dual roles in controlling ROS damage and regulating ROS signaling. Journal of Cell Biology, 217(6), 1915-1928.
Weckbecker, G., & Cory, J. G. (1988). Ribonucleotide reductase activity and growth of glutathione-depleted mouse leukemia L1210 cells in vitro. Cancer Letters, 40(3), 257-264.
Yagi, K. (1976). A simple fluorometric assay for lipoperoxide in blood plasma. Biochemia Medica, 15(2), 212-216.
Yaqoob, A. A., Ahmad, H., Parveen, T., Ahmad, A., Oves, M., Ismail, I. M., Qari, H. A., Umar, K., & Mohamad Ibrahim, M. N. (2020). Recent advances in metal decorated nanomaterials and their various biological applications: a review. Frontiers in Chemistry, 8, 341.
Yousefian, M., Ghazi, A., Amani, F., & Movaffagh, B. (2022). Mortality rate in patients admitted to the ICU based on LODS, APACHE IV, TRIOS, SAPS II. Journal of Advanced Pharmacy Education and Research, 12(1), 56-62. doi:10.51847/CgHzosuz9x
Zhou, C. Y., Wang, Y., Pan, D. D., Cao, J. X., Chen, Y. J., Liu, Y., Sun, Y. Y., & Ou, C. R. (2017). The changes in the proteolysis activity and the accumulation of free amino acids during chinese traditional dry-cured loins processing. Food Science and Biotechnology, 26(3), 679-687.
Zou, M., Zhong, Z. & Wen, C. (2021). Characterization and anti-acute myeloid leukemia and anti-acute T cell leukemia properties of zinc nanoparticles synthesized by a green approach for bioremediation applications. Archives of Medical Science. doi:10.5114/aoms/ 140295