Improving Nitrification and Denitrification Processes in Urban Wastewater Treatment Using Optimized MBBR Reactor Design Considerations
Received: 11 August 2019 / Received in revised form: 10 January 2020, Accepted: 29 January 2020, Published online: 28 February 2020
© Biochemical Technology Society 2014-2020
© Sevas Educational Society 2008
Abstract
Different physical, chemical and biological methods can be used to remove ammonia from aquatic environments. For this study, we used a plexiglass MBBR reactor. The useful volume of the pilot was 30 liters, in which the fluid-filled up to 46 cm of the reactor. Inside the pilot, the Kaldnes K3 type movable media and the polyethylene type with a total surface area of 584 m2 / m3 were used. After the pilot was completed, the entire research was carried out in three steps: (1) Start-up of the system and feeding with synthetic sewage for the purpose of biofilm formation. (2) Adaptation of the system and biofilm formation. (3) Inserting various organic loads and doing experiments. Three retention time, 4, 8 and 12 hours, and organic loading (COD) of 300, 500 and 800mg/l were used for this study. A large amount of information was obtained in this study including the removal efficiency of organic loading (BOD5, COD), nitrate and other items. Information on the optimal conditions for removing these pollutants was obtained. Also, there was a significant relationship between the removal efficiency of pollutants with pH, temperature, hydraulic retention time (HRT) and other parameters. Due to the fact that the country has suffered from a Drought and famine crisis, attention to the water cycle and the use of appropriate water treatment methods can be more and more important and one of the priorities of research in the field of environmental engineering.
Key words: MBBR, biological treatment, treatment, urban wastewater, nitrogen, phosphorus
Introduction
Nitrogen and phosphorus are two elements in urban sewage which can cause many problems due to the illegal discharge to the surface water (Ayati and Delnavaz, 2010). The wastewater of a large number of industrial units, such as paint and resin production, pesticides, insecticides, pharmaceuticals, petrochemicals, steel, and aluminum, etc., contains various pollutants, including ammonia (Powell et al., 2001; Patterson, 1975). Nitrogen can lead to eutrophication, as well as mortality and physiological changes in fish and other aquatic creatures (Farhangi and Hajimoradloo, 2011). The eutrophication phenomenon destroys aquatic organisms and also increases the growth of aquatic plants and often causes algal bloom. The most important algae of algal bloom, are green-blue algae (cyanobacteria) and when the density of algae has reached its peak, the intensity of sunlight reduced in subsurface and sludge blanket is formed on the surface of the water which creates a place for insects and harmful mosquitoes (Ayati and Delnavaz, 2010). Another problem that corresponds to the presence of nitrogen in the water, is the use of dissolved oxygen which creates many risks for the aquatic ecosystem and aquatic life. Nitrate and nitrite also rapidly get absorbed in the small intestine and after entering the bloodstream, hemoglobin is converted to methemoglobin. In addition, Nitrosamine is caused by the reaction of nitrite with other stable nitrogen compounds in the stomach (Khalili, et al., 2015). The standard nitrogen level in drinking water is 25 and the standard ammonia value is 0.05 mg/l (Rogalla et al., 1990). The amount of ammonia in effluent released from different industries varies depending on the industry and it can be between 1 and 100 milligrams per liter (Pan et al., 2008). Therefore, these materials should be treated before the sewage is discharged into the environment (Ghannadzadeh et al., 2015; Ramos et al., 2007).
Different physical, chemical, and biological methods can be used to remove ammonia from aquatic environments, the most important of these are adsorption, chemical oxidation, and biological methods, or a combination of these methods, but the best method due to the many benefits it has, are biological methods (Shokoohi et al., 2005; Chan et al., 2003; Asano et al., 2007; Khin and Ajit, 2004). One of the benefits of the biological system is that the biological method is more environmentally friendly and less dangerous from the standpoint of the environment. For example, in the adsorption method, the pollutant adsorbed on the adsorbent and later, for any reason, this pollutant may be released in the environment. Another advantage is that no chemical pollutant is used in the biological system which its sludge or wastewater subsequently contaminates the environment. The biological method is also effective and inexpensive (Shokoohi et al., 2005; DEHNOEI et al., 2012). Other disadvantages of non-biological methods can be the need for high energy which results to the high cost of the process, low efficiency, production of high amount of sludge, sludge disposal problems with high amounts of toxic substances, the need for specific chemicals and the cost-effectiveness of the process of reduction (Maleki et al., 2007; Lameiras et al., 2008). Therefore, due to the technical and economic constraints of the above methods, the biological method has been considered as a new option (Quintelas et al., 2009). Biodegradation for ammonia involves two nitrification and denitrification processes, where nitrification is the ammonia oxidation to nitrite and then to nitrate and denitrification is the reduction of nitrate and nitrite to gaseous nitrogen compounds by microorganisms (Ramos et al., 2007). Nitrification occurs by Nitrosomonas and aerobically with a dissolved oxygen concentration of greater than 1 mg/l. Denitrification is carried out by Nitrobacter and under anaerobic conditions with a dissolved oxygen concentration of less than 0.5 mg/l in which aerobic bacteria do not have enough oxygen and use nitrate as an electron receptor (Monajemi and Kazemi, 2005).
Nitrification and denitrification processes are shown in equations 1 to 4 with the assumption that acetate is used as an external carbon source (Asefi et al., 2010; Mohammadari, 2008).
First stage of nitrification:
NH+4 + 1.5O2 →N-2 + 2H- + H2O
Second stage nitrification:
NO-2 + 0.5O2 → NO-3
First stage of denitrification:
NO-3 + 3CH3OH → 9NO-2 + 3CO2 + 6H2O
Second stage of denitrification:
6NO-2 + 3CH3OH → 3NO2 + 6OH-3CO2 + 3H2O
Regarding the equations between the first and second stages of nitrification, it is clear that complete nitrification requires the creation of large volumes in aeration to create a good sludge age, supplying oxygen and sufficient alkalinity, which all of them cost a lot. Hence, the basis of the recent extensive study was on new biological methods for the removal and conversion of different forms of nitrogen from various wastewater, including wastewater containing high ammonia concentration, economic issues, and reduction of treatment costs (Ahmadi et al., 2009). Biological treatment systems are divided into two groups of stacked and suspended growth systems based on how microorganisms are deployed. In the clinging growth method, the microorganisms stick-on plastic substrates, rock and the like form the biofilms. But there is no specific substrate in the suspension method and microorganisms are suspended in the system. One of the benefits of the stacked growth compare to the suspended growth is that in the stacked system, there is a possibility of a greater number and variety of microorganisms. For this reason, their tolerance and flexibility are high in organic loads and high fluctuation (Shokoohi et al., 2005). Also, when the concentration of effluent is low, the biofilm method is much more efficient than other methods, because the cell mass is continuously in contact with fresh nutrients. The biofilm method often has more energy and more cost-effective than other methods. Biofilms also have the ability to remove various materials at very low levels (Rittmann et al., 1984). The stacked growth reactors are divided into two fixed and moving beds. One of the novel methods of biological removal of nitrogen is the nitrification and denitrification process in biological reactors with moving bed. The moving biofilm reactor is now considered to be a commercial success. And there are more than 400 MBBRs of large-scale wastewater treatment and small units for on-site treatment based on this process. The system consisted of biological/chemical treatment plants based on a low-load biofilm process and a large tank for sludge separation, which as a pre-treatment unit, sludge storage tank, treatment and balancing tank, has the ability to perform triple action (Fazaelipour et al., 2013). In a study carried out by Shore et al. (2012) entitled "Evaluation of the performance of the moving bed biofilm reactor in the treatment of high-temperature industrial wastewater treatment", a moving bed biofilm reactor was used to remove ammonia in an advanced treatment of wastewater at temperatures of 35-45 ° C and to determine the various phenotypes of bacteria responsible for the oxidation of ammonia and nitrate for nitrification at high temperatures, the reactor, at a laboratory scale in 30-40 ° C, had a successful performance with a removal efficiency above 90% ammonia ( Shore et al., 2012).
The purpose of this study was to optimize the MBBR biofilm reactor by taken into account considerations, the process, changes in design and operation, and emphasis on nitrogen removal from urban wastewater samples.
Materials and Methods
The present study was an applied-research study. Pilot studies were used for this purpose.
Steps of Research
In general, this research was carried out in four stages: Stage 1: Pilot construction. Stage 2: Start-up of the system and feeding with synthetic sewage for the purpose of biofilm formation. Stage 3: Adaptation of the system and biofilm formation and stage. Stage 4: Inserting various organic loads and doing experiments.
First Stage
1- Pilot
The pilot study was made of Plexiglas with a thickness of 0.5 cm, which was electronically controlled by the electric control system (Fig. 1). The total volume of the pilot was 0.035 cubic meters with length and width of 25.5cm, a height of 54cm and was sealed by an aquarium glue. The pilot has 5 sampling valves that are located vertically in the middle of one of the walls with distance 5cm (The purpose of installing these valves was to increase conduction capacities and application of pilot). The useful volume of the pilot was 30 liters, in which the fluid-filled up to 46cm of the reactor. Of the total useful volume of the pilot, 12 liters were variable volume (working volume) and taken into account 60 percent media filling and 18 liters were fixed volume. The bioreactor specifications are given in Table 1.
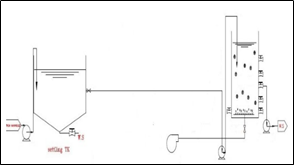
Figure 1. Schematic design of the MBBR process used in the study
Table 1. Bioreactor Specifications Used in the study
|
Parameters |
Amount |
|
Reactors type |
Plexiglass |
|
Wall Thickness (mm) |
5 |
|
Interior length (cm) |
25.5 |
|
Interior Width (cm) |
25.5 |
|
Reactor Height (cm) |
54 |
|
Reactor Height at 60% filling (cm) |
46 |
|
Free Space (cm) |
8 |
|
Total Pilot Length (L) |
35 |
|
Useful Volume of Pilot(l) |
30 |
|
Percentage of filled Media |
60 |
2-1) For mixing in anaerobic phase, we used a gearbox at a speed of 45 rpm and ZHENG brand with power 12V AC type and connected to the controller system.
3-1) MBBR pilot aeration system was supplied using a tiny bubble diffuser embedded in the pilot floor. The required air was supplied using a piston air compressor with a nominal air capacity of 80 liters per minute.
4-1) The prepared pumps with a discharge rate of 40 liters per minute and a nominal height of 38m was installed.
5-1) The pilot control system consisted of an electric circuit in which all of the pilot operation cycles were planned and by selecting the program and the cycle that was previously included on the controller's system, the pilot was conducted.
6-1) Inside the pilot, the Kaldnes K3 type movable media and the polyethylene type with a total surface area of 584 m2 / m3 were used.
Table 2. Media Specifications Used in this Study
|
Parameter |
Rate |
|
Media material |
HDPE |
|
Media type |
3K |
|
Total specific area |
584m2/m3 |
|
Specific protected area |
500m2/m3 |
|
Diameter |
25mm |
|
Height |
10mm |
|
Nitrification rate in laboratory conditions |
560 grams per cubic meter of media per day |
|
The COD removal rate in laboratory conditions |
1200 grams per cubic meter of media per day |
|
Denitrification Rate in laboratory Conditions |
670 grams per cubic meter of media per day |
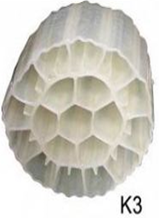
Figure 2. Media used in the study
2- Installation
After the construction of the pilot, it was filled with water for three days, to ensure that there is no leakage in the pilot body. The pilot and feed tank are connected to one another using the necessary connections. These connections included water hoses, ac pipes, galvanized connections and sealing materials. Once the connections have been completed, the control system was connected. The control system had inputs and outputs for pilot control.
3- Control System and Instrumentation
The command circuit used in this study was digital. Required devices such as LLC with MICRO brand, weekly digital timer with Shiva Wave brand, a delayed ON/OFF timer with MICRO brand, ten-terminals, miniature fuses, platinum bars, dual-core telephone wires, 0.5-wire cable, and neoprene boards, all screwed on, were bought and installed. In figure 3: Schematic design of the electrical control circuit used in the MBBR process is shown.
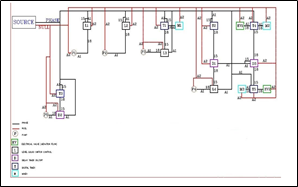
Figure 3. schematic design of the electric control circuit applied in the MBBR process
4- Sampling of the System
As shown in Fig. 4, on the pilot, 5 sampling valves were embedded and used for manual sampling. To reduce the error of the experiment and to ensure the accuracy in the system, for a sampling of the system, No. 3 and No. 5. valves were used.
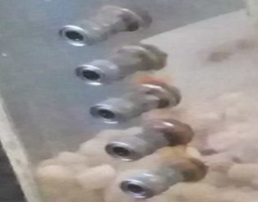
Figure 4. Sampling valves embedded on the pilot
Second Stage
The feed tank was built for the system was 120-liter. The performance accuracy of the pilot equipment was tested by filling the feed tank from the water and starting it a 2-hour cycle for a week. Then, the return activated sludge was transferred from the return sludge line of Sahebqaraniyeh which is one-third of the pilot volume of thickened sludge, was filled in half an hour. At this stage, for a week outside the cycle, there was an attempt to manually feed the pilot to sit down the biofilm on the bed. The sewage transfer to the pilot was then carried out in a two-hour time cycle. The amount of feed entered into the pilot at each time cycle was 12 liters which was 1.5 times diluted. We used synthetic sewage containing 5g of dry milk, 5g glucose, 2g of urea and 0.5g of phosphorus which were dissolved in 100 liters of water. The designed time cycles for Pilot include wastewater feeding, anoxic time, aeration time, sedimentation time, discharge time, and rest of the reactor. After this period, the biofilm was formed on aerobic-anoxic pilot acne and the system was ready for testing. The MLVSS and MLSS experiments were performed before starting the bioreactor on prepared sludge whose values were within the conventional range for the active sludge system, 3000 mgr/l and 2100 mgr/l, respectively. Due to some parts of the process used that were aerobic-anoxic, the amount of oxygen needed for cell metabolism along with pH during the study period was kept within the standard range for biological reactions. In mixing status in the anoxic phase, the oxygen content was 0.3-0.5 mg/l and the pH was maintained at a range of 7-7.5. By using compressors, the amount of aeration in the bioreactors was adjusted accordingly, which, in addition to aeration, a slow mixture inside the reactor was achieved and the amount of dissolved oxygen was in the range 4.5-3.5 mg/l. Also, pH levels remained fixed at all stages of the study at the range of 7.5-6.5. During the operation period, the temperature of the bioreactor was also determined by special thermometers at about 21-25 ° C. To measure the system capability in different organic loads and time cycles, Initially, by studying the related articles and studies and the guidance of the relevant faculty members, the number of organic loads and the required time cycles were determined Table 3.
Table 3. the program cycle given to command circuit
|
Hydraulic Retention time |
COD(g/L) |
||
|
12 |
8 |
4 |
300 |
|
12 |
8 |
4 |
500 |
|
12 |
8 |
4 |
800 |
Third Stage
In moving biofilm reactors, the microorganisms sticking to the acne are responsible for the main treatment in the system. Initially, microorganisms were given the opportunity to form biofilms on the acne using synthetic sewage. Then, using carbon as the source of micronutrients removes them. Over time, a biological layer was created on the surface of the acne. In general, the adaptation step of microorganisms lasted about 3 weeks and as mentioned above, with each increase in COD concentration, repetitions of loading until the steady-state were continued. So, at the beginning of the bioreactor start-up, by measuring COD removal efficiency, the removal of contaminants by microorganisms was investigated and each concentration repeated several times so that the removal efficiency that is roughly constant was achieved and then the concentration was increased. By this method, although a longer period was spent on the adaptation of microorganisms, the result of the work was sufficiently reliable.
Fourth Stage
Various organic loads were entered into the system in Table 3. and the corresponding experiments were performed according to Table 4.
Table 4. Control and measurement parameters, amount and measurement methods
|
Parameter |
Measurement Method |
Amount |
Time |
Measurement Instruction |
|
PH |
pH meter manufactured by HACH company |
6.5-7.5 |
daily |
4500-H+B |
|
DO for anoxic phase |
DO meter manufactured by HACH company |
0.3-0.5 mg/L |
momentary |
4500 -OG |
|
DO for aerobic phase |
DO meter manufactured by HACH company |
4-5.6 mg/L |
momentary |
4500 -OG |
|
Temperature Control |
thermometer |
20˚ c |
momentary |
- |
|
COD |
COD Vials, TNT+ type HACH Company |
300,500,800 mg/L |
Daily |
5220 B |
|
BOD5 |
BOD meter manufactured by HACH company |
- |
periodic |
5210 -B |
|
MLSS |
Gravimeter |
- |
Daily |
2540 D |
|
MLVSS |
Gravimeter |
- |
Daily |
2540 E |
|
nitrate |
photometry |
- |
Daily |
2541 |
Statistical Analysis
After the experiments, the data was entered into the Excel software and the graphs related to the results were drawn.
Results and Discussion
After statistical analysis, the information obtained was as follows;
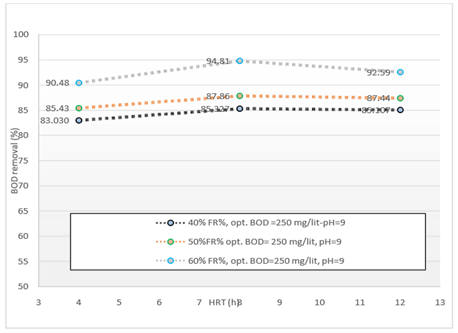
Figure 5. The Comparison of BOD removal efficiency in optimal conditions obtained in different HRTs during operation of the reactor
According to Figure 5. the MBBR system has been shown to have a good effect on the removal of BOD5 from wastewater. In this study, we tried to consider the optimum condition for the BOD5 parameter in 3% filling. According to the data obtained by introducing the organic load (BOD5) 250mg/l into the system at three measured HRT 4, 8 and 12 hours, the maximum removal efficiency were 90.48, 94.81 and 92.59%, respectively. Optimum conditions for removing BOD5 were obtained at 60% media filling and pH = 9. Also, with the increase of HRT, the BOD removal efficiency increased, too.
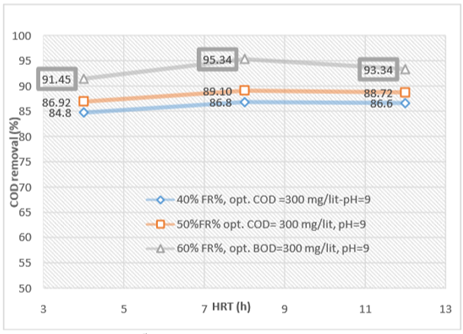
Figure 6. The comparison of COD removal efficiency in optimal conditions obtained in different HRTs during operation of the reactor
According to figure 6, the MBBR system has been shown to have a good effect on the removal of COD from wastewater. By introducing the organic load (COD) 300mg/l into the system in an optimal condition at three measured HRT, 4, 8 and 12 hours, the maximum removal efficiency were 91.45, 95.34 and 93.34%, respectively. Also, with the increase of HRT, the COD removal efficiency increased, too.
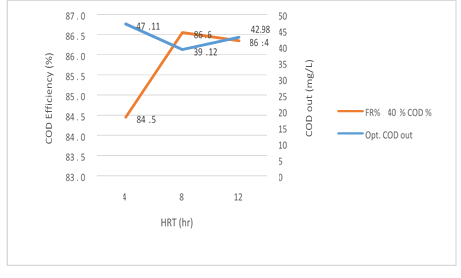
Figure 7. The efficiency of the MBBR reactor in the relationship between removal efficiency and output organic loading in 40% media filling in optimal conditions
According to figure 7 a significant relationship between the HRT variable, the COD and COD removal efficiency in the effluent from the reactor in the organic loading of 300mg/l in influent, is shown in the MBBR system. As seen, the output COD value decreases gradually from 4 to 8 hours with an increase in the retention time and has a slight increase from 8 to 12 hours, while COD removal efficiency increases by a significant difference of 4-8 hours, it has a slight reduction from 8 to 12 hours. The reason for this behavior of the reactor can be attributed to the high retention time of the reactor which was formed after 12 hours of the Endogenous phase of microorganisms and the system shows a reverse effect. So, in the amounts 47.11, 39.12 and 42.98mg/l, the removal efficiency achieved were 84.5%, 86.6% and 86.4%, respectively. The most optimum experimental phase was obtained in 40% media filling, which occurred at an input load of 300mg/l and it can be seen that the system has a good performance in removing organic matter.
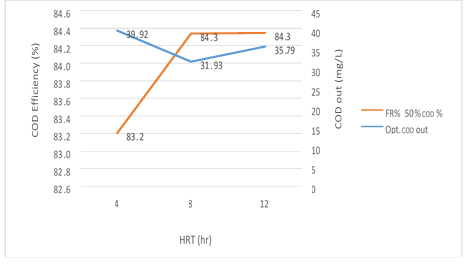
Figure 8. The efficiency of the MBBR reactor in the relationship between removal efficiency and organic loading output in 50% media filling in optimal conditions
According to figure 8, a significant relationship between the HRT variable, the COD and COD removal efficiency in the effluent from the reactor in the organic loading of 300mg/l in influent is shown in the MBBR system. The output COD value decreases gradually from 4 to 8 hours with an increase in the retention time and has a slight increase from 8 to 12 hours, while COD removal efficiency increases by a significant difference of 4-8 hours and has undergone a steady trend for 8 to 12 hours. The results showed that in the amounts 39.92, 31.93 and 35.19 mg/l, the removal efficiency achieved were 83.2%, 84.3% and 84.3% respectively. The most optimum experimental phase was obtained in 50% media filling, which occurred at an input load of 300mg/l and it can be seen that the system has a good performance in removing organic matter.
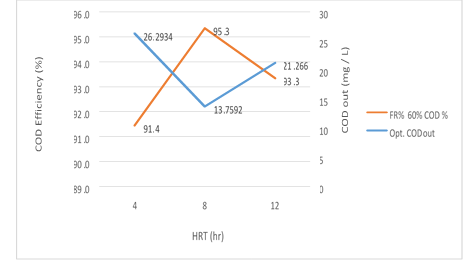
Figure 9. The efficiency of the MBBR reactor in the relationship between removal efficiency and organic loading output in 60% media filling in optimal conditions
According to figure 9, a significant relationship between the HRT variable, the COD and COD removal efficiency in the effluent from the reactor in the organic loading of 300mg/l in influent is shown in the MBBR system. The output COD value decreases gradually from 4 to 8 hours with an increase in the retention time and has a slight increase from 8 to 12 hours, while COD removal efficiency increases by a significant difference of 4-8 hours but it has a slight reduction from 8 to 12 hours. The reason for this behavior of the reactor can be attributed to the high retention time of the reactor which was formed after 12 hours of the Endogenous phase of microorganisms and the system shows a reverse effect. This behavior seems more intensive in the higher media fill rate due to the increase in MLSS. So, in the amounts 26.83, 14.04 and 21.7 mg/l, the removal efficiency achieved were 91.3%, 95.2% and 93.2%, respectively. The most optimum experimental phase was obtained in 60% media filling, which occurred at an input load of 300mg/l and it can be seen that the system has a good performance in removing organic matter.
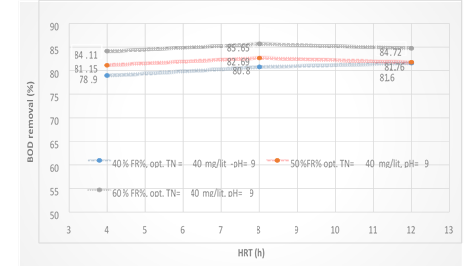
Figure 10. Comparison of total nitrogen removal efficiency at different media filling levels at different HRT
Figure 10 has shown the comparison of total nitrogen removal efficiency at different media filling levels at different HRT. By increasing the media filling percentage, the system has a more efficient performance in total nitrogen removal. With increasing HRT, as expected, no significant changes were observed in nitrogen removal. Here, the question raised; Is whether the achievement of removal efficiency 2-3% more is economical? Overall, it was observed that the MBBR system had an acceptable performance in total nitrogen removal.
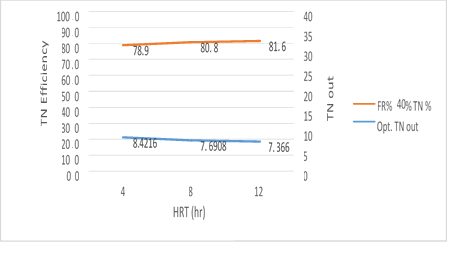
Figure 11. MBBR reactor efficiency in the relationship between removal efficiency and the output total nitrogen in 40% media filling
Figure 11 has shown a significant relationship between 3 variables, HRT, the TN and the output TN removal efficiency of the reactor at the input load of 300mg/l to the MBBR system. The output TN is gradually reduced by increasing the retention time, while TN removal efficiency is also increased by increasing the HRT. The results are as follows which in the amounts 26.27, 6.63 and 6.35 mg/l of total nitrogen output, the removal efficiency of 81.9%, 83.4%, and 84.1% were obtained respectively. The most optimum experimental phase was obtained in 40% media filling, which occurred at an input load of 300mg/l, total nitrogen input 40mg/l and pH=9 and it can be seen that the system has a good performance in removing total nitrogen.
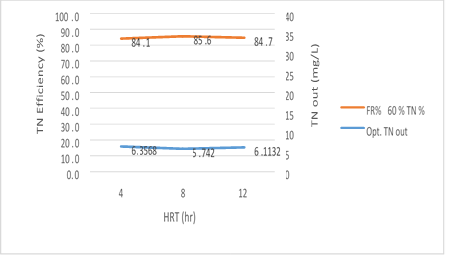
Figure 12. MBBR reactor efficiency in the relationship between removal efficiency and the output total nitrogen in 50% media filling
Figure 12 has shown a significant relationship between 3 variables; HRT, the TN and the output TN removal efficiency of the reactor at the input load of 300mg/l to the MBBR system. As seen, the output TN value decreases gradually from 4 to 8 hours with an increase in the retention time but it increases from 8 to 12 hours, while TN removal efficiency is increased with an increase in the HRT from 4 to 8 hours but has a slight reduction from 8 to 12 hours. The reason for this behavior of the reactor can be attributed to Sloughing, which has a significant relationship with the filling rate. There is also a reverse relationship between filling rate and HRT for Sloughing which can be cited. The results of this study showed that in the amounts 5.5, 5.97 and 6.29 mg/l of total nitrogen output, the removal efficiency 83.8%, 85.1%, and 84.3%, were obtained, respectively. The most optimum experimental phase was obtained in 50% media filling, which occurred at an input load of 300mg/l, total nitrogen input 40mg/l and pH=9 and it can be seen that the system has a good performance in removing total nitrogen.
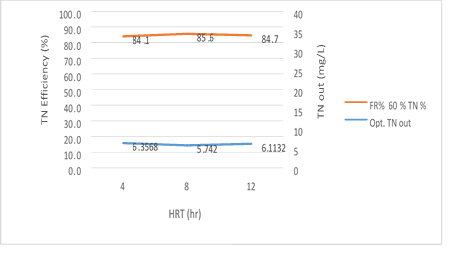
Figure 13. MBBR reactor efficiency in the relationship between removal efficiency and the output total nitrogen in 60% media filling
Figure 13 has shown a significant relationship between 3 variables; HRT, the TN and the output TN removal efficiency of the reactor at the input load of 300mg/l to the MBBR system. The output TN value decreases gradually from 4 to 8 hours with an increase in the retention time but it increases from 8 to 12 hours, while TN removal efficiency is increased with an increase in the HRT from 4 to 8 hours but has a slight reduction from 8 to 12 hours. The reason for this behavior of the reactor can be attributed to Sloughing, which has a significant relationship with the filling rate. There is also a reverse relationship between filling rate and HRT for Sloughing which can be cited. The results of this study showed that in the amounts 5.48, 4.98 and 5.27mg/l of total nitrogen output, the removal efficiency 86.8%, 87.6%, and 86.8% were obtained, respectively. The most optimum experimental phase was obtained in 60% media filling, which occurred at an input load of 300mg/l, total nitrogen input 40mg/l and pH=9 and it can be seen that the system has a good performance in removing total nitrogen.
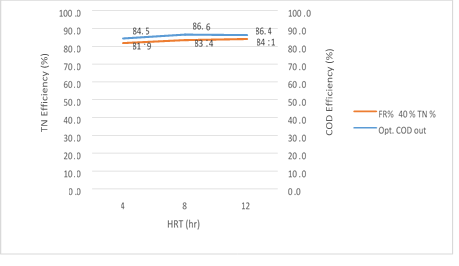
Figure 14. The efficiency of the MBBR reactor in the relationship between the removal efficiency of total nitrogen and organic loading in 40% media filling in optimal conditions
Figure 14 illustrates that the MBBR system has the ability to simultaneously remove nitrogen and organic matter from the wastewater in an organic loading of 300mg/l and 40% media filling. By increasing the HRT, the removal efficiency of total nitrogen and organic loading rates are also increased. Is there a greater economic justification for energy consumption, in order to achieve about 3 to 4 percent more of the efficiency of removal or not?
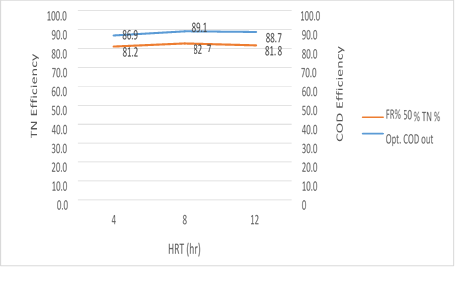
Figure 15. The efficiency of the MBBR reactor in the relationship between the removal efficiency of total nitrogen and organic loading in 50% media filling in optimal conditions
Figure 15. illustrates that the MBBR system has the ability to simultaneously remove nitrogen and organic matter from the wastewater in an organic loading of 300mg/l and 50% media filling. By increasing the HRT, the removal efficiency of total nitrogen and organic loading rates are also increased. Is there a greater economic justification for energy consumption, in order to achieve about 3 to 4 percent more of the removal efficiency or not? It is noteworthy, however, that a slight reduction in removal efficiency of organic matter and TN has been observed for 12 hours, which can be related to the media filling rate and subsequently the increase in the levels of MLVSS present in the system.
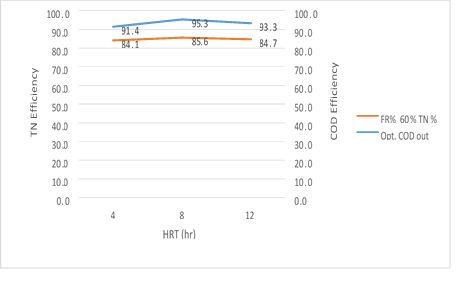
Figure 16. The efficiency of the MBBR reactor in the relationship between the removal efficiency of total nitrogen and organic loading in 60% media filling in optimal conditions
Figure 16. illustrates that the MBBR system has the ability to simultaneously remove nitrogen and organic matter from the wastewater in an organic loading of 300mg/l and 60% media filling. By increasing the HRT, the removal efficiency of total nitrogen and organic loading rates are also increased. It is noteworthy, however, that a slight reduction in removal efficiency of organic matter and TN has been observed for 12 hours, which can be related to the media filling rate and subsequently the increase in the levels of MLVSS present in the system.
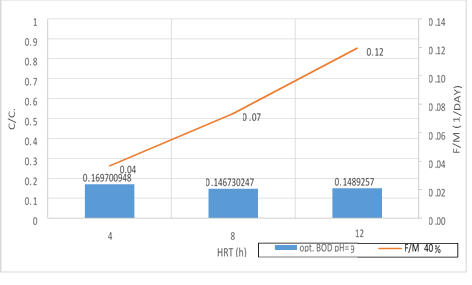
Figure 17. A significant relationship between F/M ratio with BOD5 consumption in 40% filling and organic loading of 300mg/l in 3 variables of HRT in pH = 9
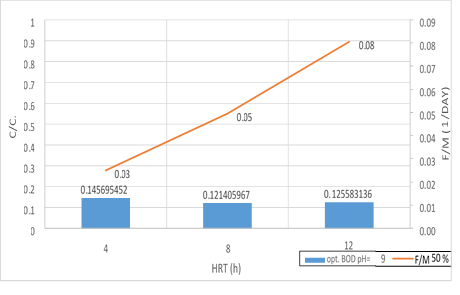
Figure 18. Significant relationship between F/M ratio with BOD5 consumption in 50% filling and organic loading of 300mg/l in 3 variables of HRT in pH = 9
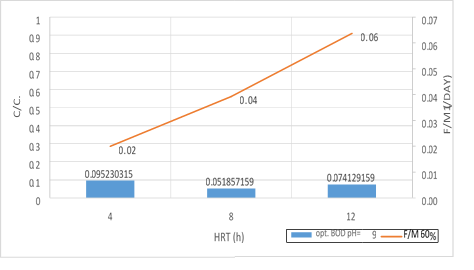
Figure 19. A significant relationship between the F/M ratio with BOD5 consumption in 60% filling and organic loading of 300mg/l in 3 variables of HRT in pH = 9
According to the figures (17, 18 and 19), there is a significant relationship between the F/M ratio and BOD5 consumption in organic loading of 300mg/l in 3 variables of HRT. As the retention time increased, the F/M as well as BOD5 consumption increased. Over time of the adaptability of the system, the growth of microorganisms has increased in the system and the amount of feed (organic matter) has decreased. In fact, this figure can explicitly provide appropriate guidance on the relationship between feed and microorganisms in the system. As the retention time increased, the activity of microorganisms in the system increased too and the more organic matter they consume, which has led to a decrease in the food matters and the presence of microorganisms in Endogenous conditions. This is associated with a decrease in MLVSS. As a result, the F/M ratio increased. Therefore, there is a direct relationship between the HRT and F/M in the MBBR system. It can also be claimed that an increase in F/M has a negative effect on the consumption of organic matter. Finally, the F/M ratio was obtained for optimum BOD5 consumption (0.02-0.07). Mean Cell Residence Time (MCRT) is recommended for this part of operation 15 to 50 days.
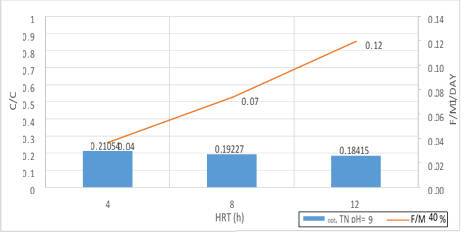
Figure 20. A significant relationship between F/M ratio with TN consumption in 40% filling and organic loading of 300mg/l in 3 variables of HRT in pH = 9
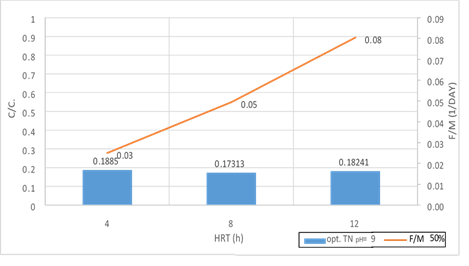
Figure 21. A significant relationship between F/M ratio with TN consumption in 50% filling and organic loading of 300mg/l in 3 variables of HRT in pH = 9
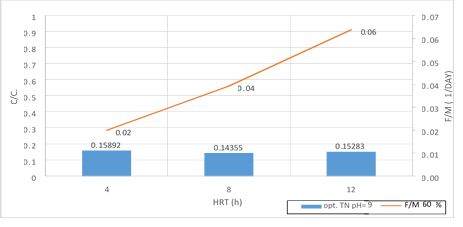
Figure 22. A significant relationship between F/M ratio with TN consumption in 60% filling and organic loading of 300mg/l in 3 variables of HRT in pH = 9
According to the figures (17, 18 and 19), there is a significant relationship between F/M ratio and TN consumption in organic loading of 300mg/l in the 3 variables of HRT. As the retention time increased, the F/M as well as TN consumption increased. Over time of the adaptability of the system, the growth of microorganisms has increased in the system absolutely and the amount of feed (Nitrogenous organic matter) has decreased. Indeed, this figure can explicitly provide appropriate guidance on the relationship between feed and microorganisms in the system. As the retention time increased, the activity of microorganisms in the system increased too and the more organic matter they consume, which has led to a decrease in the food matters and the presence of microorganisms in Endogenous conditions. This is associated with a decrease in MLVSS. As a result, the F/M ratio increased. Therefore, there is a direct relationship between the HRT and F/M in the MBBR system. It can also be claimed that an increase in F/M has a negative effect on the consumption of organic matter. Finally, the F/M ratio was obtained for optimum TN consumption (60% filling) 0.02-0.07. Mean Cell Residence Time (MCRT) is recommended for this part of operation 15 to 50 days.
By reviewing and the analysis of the results from Figures 5 to 21, significant data was obtained and the results which were used by researchers and operators of the water and wastewater industry, are presented as follows.
According to the data obtained in this study, it was found that the MBBR system with input organic loading to the system in the amount of 300mg/l in HRT= 8 hour, 60% filling and pH = 9, has the highest COD removal efficiency (95.2%). The COD residue in this optimal phase was 14.04mg/l which was below the standard set by the environmental organization for the discharge of wastewater into the environment. This illustrates the effective functioning of the system to achieve the environmental standard.
It was also found that the MBBR system at the input organic loading rate to the system in the amount of 800mg/l in HRT= 8 hours, 40% filling and pH = 5, has achieved the lowest COD removal efficiency by 65.5%. The COD residue in this optimal phase was 273.18mg/l, which was more than the standard set by the environmental organization for the discharge of wastewater into the environment.
According to the results, it was determined that the MBBR system had achieved the highest COD removal efficiency (87.6%) with input organic load rate (300mg/l) and the total input nitrogen (40mg/l) for 8 hours, 60% filling and pH=9. The COD residue in this optimal phase was 4.95mg/l which was below the standard set by the environmental organization for the discharge of wastewater into the environment. This illustrates the effective functioning of the system to achieve the environmental standard.
It was also found that the MBBR system at the input organic loading rate (800mg/l) to the system in HRT= 4 hours, 40% filling and pH = 5, has achieved the lowest TN removal efficiency by 57.1%. The TN residue in this optimal phase was 17.15mg/l which was below the standard set by the environmental organization for the discharge of wastewater into the environment.
Fazaelipour et al carried out a process simulation and an experimental study on the simultaneous removal of carbon and nitrogen from Bistoun city sewage in a moving bed biofilm reactor (MBBR). In this study, the removal of total nitrogen (TN, NO3-N, COD, N-NH) and growth of suspended biomass during the SND process in the MBBR reactor was studied by mathematical modeling. In this model, the mass transfer of oxygen from the gas to liquid phase, the mass transfer of organic materials 4 + NO3, N-NHN, oxygen from the liquid phase to the biofilm, the biochemical reaction in the liquid phase and biofilm and the presence of different types of aerobic heterotrophic bacteria, nitrifiers and denitrifiers were considered. The finite-difference method was used to break the existing equations in the model and the algorithm for the numerical solution of equations was written using the 9.7MATLAB software. To check the accuracy of the model, the results of the urban wastewater treatment plant of Bistoun (Kermanshah) in a MBBR system with two types of fillers with a specific surface area (500 m²/kg) and two numerical dissolved oxygen (DO) variables (2-4 mg/l) and HRT = between 4-12 hours was used. An appropriate adaptation of modeled results with data showed that the proposed model is able to predict the performance of the MBBR system accurately. This mathematical model can be used as a suitable tool for predicting the behavior of Stable and Dynamic Mode of Process (SND) in MBBR in wastewater treatment. Checking the responses of the obtained levels of regression showed that, the best status of removal efficiency of TSS, TN and COD were 24/75%, 77/44% and 35/82% respectively. The form ring filler was achieved with NO3-N concentration of 15.22mg/l, a HRT = 4.64 hours and DO = 72.3mg/l, (Fazaelipour et al., 2013). Also, in order to investigate the effects of the studied variables on the population of different species of nitrogen users, NOB, Nitrite (oxidizing bacteria), AOB tests (Ammonium oxidizing bacteria) in the selected operating conditions of DO (3mg/l) and with HRTs of 4, 8 and 12 hours, has been carried out. In all tested conditions, the NOB population was more than AOB (Mirbagheri, 2014). Ali Balader et al also conducted a study on the performance of moving bed biofilm reactor (MBBR) in the treatment of urban and industrial wastewater mixtures. In this study, MBBR performance was considered in the treatment of urban and industrial wastewater mixtures (Parkand abad wastewater treatment plant of Mashhad). According to the results of pilot studies, the MBBR has the ability to remove CODs by 76, 57, and 43 percent at the times 12, 24 and 8 hours. It also has the ability to tolerate the hydraulic and organic shocks, so the time to achieve system stability after applying short hydraulic shocks and output COD fluctuations before and after applying the shock was lower than (70mg/l) (YARI, and Balador, 2008). Given that the study only had temperature control and was not considered as a variable, it is noteworthy to mention a study by Jennifer et al about moving bed biofilm reactor performance review on advanced treatment of industrial effluents with high temperature (Shore et al., 2012). In the experiment, a moving biofilm reactor was used to remove ammonia in the advanced treatment of wastewater with temperature (45-35°C) and to identify different phonotypes of bacteria responsible for the oxidation of ammonia and nitrate for nitrification at high temperatures. The reactor at the laboratory scale at a temperature of 30-40°C has a successful performance with the removal efficiency of above 90% ammonia (above 19mg/l of NH3-N) of industrial waste (Behbahani et al., 2011). In 2008, Shaowei et al. investigated the simultaneous removal of nitrogen and COD, using an aerated carbon membrane biofilm reactor. The reactor was used for HRT = 20 hours and performed well even at HRT lower than 12 hours. The removal efficiency of COD, ammoniacal nitrogen (NH4 + -N) and total nitrogen (TN) were 86%, 94% and 84%, respectively. The results of this study showed that during lower retention time, we achieved the highest TN removal rate (Shaowei et al., 2008).
Conclusion
Due to the fact that the country has suffered from a Drought and famine crisis, therefore, attention to the water cycle and the use of appropriate water treatment methods can be more important and one of the priorities of research in the field of environmental engineering.
Conflicts of interest
None declared.
References
ASANO, T., BURTON, F. L., LEVERENZ, H. L., TSUCHIHASHI, R., & TCHOBANOGLOUS, G. (2007). METCALF & EDDY. Water Reuse: Issues, Technologies, and Applications. USA: McGraw-Hill.
Asefi B AA. (2010). Investigation and design of biological treatment process in industrial wastewater. Ghalame Elm.:118.
Ayati B GH, & Delnavaz M. (2010). Application of Movable Bed Biofilms (MBBR). Tarbiat Modares University Press.
Behbahani, M., ALAVI, M. M., & Arami, M. (2011). A comparison between aluminum and iron electrodes on removal of phosphate from aqueous solutions by electrocoagulation process.
Chan, T. Y. (2003). Ammonia removal in wastewater with anaerobic ammonium oxidation process (Doctoral dissertation, Concordia University).
DEHNOEI, A., GANJIDOUST, H., AYATI, B., & EMTIAZI, G. (2012). Comparison of Partial and Complete Nitrification in SBR System for Use in Side Stream Processes.
Farhangi, M., & Hajimoradloo, A. M. (2011). The effect of zeolite (Clinoptilolite) in removing ammonia lethal concentration in Rainbow Trout (Oncorhynchus mykiss). Iranian Scientific Fisheries Journal, 20(1), 101-109.
Fazaelipour M GE. (2013). Process Modeling and Experimental Investigation of Simultaneous Removal of Carbon and Nitrogen from Bisotun City Wastewater in a Movable Bed Biofilm Reactor (MBBR). Ministry of Science, Research, Technology - the Shahid Bahonar University of Kerman - Faculty of Engineering.
Ghannadzadeh, M. J., Jonidi-Jafari, A., Rezaee, A., & Soltani, R. D. C. (2015). Biodegradation of Phenol in Synthetic Wastewater Using a Fixed Bed Reactor With up Flow Sludge Blanket Filtration (FUSBF). Global journal of health science, 7(7), 120.
Khalili, M., & Ebrahimzadeh, M. A. (2015). A review on antioxidants and some of their common evaluation methods. Journal of Mazandaran University of Medical Sciences, 24(120), 188-208.
Khin, T., & Annachhatre, A. P. (2004). Novel microbial nitrogen removal processes. Biotechnology advances, 22(7), 519-532.
Lameiras, S., Quintelas, C., & Tavares, T. (2008). Biosorption of Cr (VI) using a bacterial biofilm supported on granular activated carbon and on zeolite. Bioresource technology, 99(4), 801-806.
Maleki, A., Erfan, M. B., Mohammadi, A. S., & Ebrahimi, R. (2007). Application of commercial powdered activated carbon for adsorption of carbolic acid in aqueous solution. Pak J Biol Sci, 10(14), 2348-52.
Mirbagheri A AR. (2014). Aerobic-anaerobic treatment of high COD sewage with biofilm with a mobile bed reactor method. Ministry of Science, Research, Technology - Khaje Nasir-e-Din Tusi University of Technology - Civil Engineering Faculty. 1393.
MOHAMMAD, Y. N., & Balador, A. (2008). Performance of MBBR in the treatment of combined municipal and industrial wastewater a case study: Mashhad sewage treatment plant of Parkandabad.
Mohammadari N BA. (2008). Investigating the Function of Mobile Platform Biofilm (MBBR) in Urban and Industrial Sewage Treatment Refinery Case Study: Perkand Abad Wastewater Treatment Plant in Mashhad. Quarterly journal of water and sewage. 65(19).
Monajemi, P., & Kazemi, H. (2005). Treatability of petrochemical waste using a pilot scale SBR system. Journal of Water & Wastewater, 16(53), 48-53.
Pan, G., & Kurumada, K. I. (2008). Hybrid gel reinforced with coating layer for removal of phenol from aqueous solution. Chemical Engineering Journal, 138(1-3), 194-199.
Patterson, J. W. (1975). Waste-water treatment technology. Ann Arbor Sc Pub. Inc, Ann Arbor, Mich,$ 12. 40, 257.
Powell, C. H., & Cohrssen, B. (2001). Asbestos. Patty's Toxicology.
Quintelas, C., Rocha, Z., Silva, B., Fonseca, B., Figueiredo, H., & Tavares, T. (2009). Biosorptive performance of an Escherichia coli biofilm supported on zeolite NaY for the removal of Cr (VI), Cd (II), Fe (III) and Ni (II). Chemical Engineering Journal, 152(1), 110-115.
Ramos, A. F., Gomez, M. A., Hontoria, E., & Gonzalez-Lopez, J. (2007). Biological nitrogen and phenol removal from saline industrial wastewater by submerged fixed-film reactor. Journal of hazardous materials, 142(1-2), 175-183.
Rittmann, B. E., & Brunner, C. W. (1984). The nonsteady-state-biofilm process for advanced organics removal. Journal (Water Pollution Control Federation), 874-880.
Rogalla, F., Ravarini, P., Larminat, G. D., & Couttelle, J. (1990). Large‐scale biological nitrate and ammonia removal. Water and Environment Journal, 4(4), 319-328.
Shaowei, H. U., Fenglin, Y. A. N. G., Cui, S. U. N., ZHANG, J., & Tonghua, W. A. N. G. (2008). Simultaneous removal of COD and nitrogen using a novel carbon-membrane aerated biofilm reactor. Journal of Environmental Sciences, 20(2), 142-148.
Shokoohi, R., Hajia, M., Jonaidi, A., Attar, H. M., & Parvaresh, A. (2005). Identification of Phenol Degrader Aerobe Bacteria in Combined Biological Phenol Treatment System of Biofilter and Activated Sludge.
Shore, J. L., M’Coy, W. S., Gunsch, C. K., & Deshusses, M. A. (2012). Application of a moving bed biofilm reactor for tertiary ammonia treatment in high temperature industrial wastewater. Bioresource technology, 112, 51-60.