An Extended Casson Equation for Rheological Properties of Soybean Oil at Different Temperatures and Atmospheric Pressure
I. Stanciu, N. Ouerfelli
Abstract
There are several mathematical models used to describe the rheology of non-Newtonian fluids, but these are not limited to the following models; Power Law, Bingham, Hershel-Buckley, and Casson. Selecting the best rheological model that accurately represents the shear rate analysis with the shear stress is one of the rheology's wishes. Therefore, this study proposes a new rheological model which can be called (Casson-Stanciu) and that it extends the usual Casson expression and accurately represents the rheology of soybean oil. Moreover, with its additional corrective parameter (δ), this model can show the amount and sign of the deviation to the Casson linearity expressing in term of square root, the shear stress-shear rate dependence and classifying then the nature of the non-Newtonian fluid, according to the temperature value, as a type of super Casson or sub-Casson behavior in all the studied range of temperatures characterized by a sign-change temperature revealing, then an interesting overturning temperature (Tcs) which can be called Casson-Stanciu temperature characterizing the studied fluid and it will be an excellent criterion of discussion, interpretation, and classification of rheological fluid behavior.
Key words: Casson equation; extended model; correlation; modeling; rheology; soybean oil
Introduction
Rheology deals with the study of the requests, and the response of the bodies to the requests, establishes the mathematical models that form the response function of a body subject to the requests. By applying a force or a system of forces to a body, the body will be placed in motion. The movement can be done by displacements, deformations and displacements and deformations (Ahmed et al., 2018). In general, fluids can be classified into the Newtonian fluid in which the shear stress is directly proportional to the shear velocity and a single parameter known as the viscosity characterizing the fluid and non-Newtonian fluid, whereby shear stress is a function of velocity predominant shear (Coussot et al., 2002; Stanciu, vol. 6; Reiner, 1926; Casson, 1959; Murari et al., 2019). Most vegetable oils are non-Newtonian fluids that meet one of the usual models: Power Law, Bingham, Hershel-Buckley, and Casson (Coussot et al., 2002; Stanciu, vol. 6; Reiner, 1926; Casson, 1959; Herschel and Bulkley, 1926; Bingham, 1922; Hemphill et al., 1993).
When designing machines, installations, and pipelines, it is necessary to take into account the non-Newtonian behavior of fluids. Mass and heat transfer coefficients are significantly affected by fluid behavior. Particular attention should also be paid to choosing the right mixing and pumping equipment (Coussot et al., 2002; Stanciu, vol. 6; Reiner, 1926).
Rheological models for non-Newtonian liquids can be grouped into three categories. We have the empirical model that is derived from the examination of experimental data and one example is the rheological model of the law of power (Casson, 1959). The structural model includes the Casson model (Herschel and Bulkley, 1926) and the Hershel-Buckley model (Bingham, 1922). There is also a theoretical model that indicates the factors that influence a rheological parameter and are examples, the Krieger-Dougherty model (Coussot et al., 2002) for the relative viscosity and the Bingham Plastic model (Hemphill et al., 1993).
The following mathematical models are used to describe the rheology of non-Newtonian fluids. The most utilized are the Power Law model (Casson, 1959), the Bingham Plastic model (Hemphill et al., 1993), the Hershel-Buckley Model (Bingham, 1922), and the Casson Model (Herschel and Bulkley, 1926).
The Power Law model (Casson, 1959) has the following expression:
 (1)
(1)
where n is the behavioral index of fluid flow, which indicates the tendency of a fluid to shear thin and has no dimensions and k is the coefficient of consistency.
When n <1, the fluid becomes thinner, and when n> 1, the fluid thickens. (Reiner, 1926)
Parameters k and n can be determined from the logτ diagram against logγ and the intercept of the resulting straight line is logk, and the slope is n.
The power-law model provides better information on low shear speed, but has disadvantages under high shear speed conditions (Becker et al., 2003).
The Bingham plastic model is a two-parameter model that is widely used in the drilling fluid industry to describe the flow characteristics of many types of fluids. Mathematically, it can be represented as:

(2)
where τo is the yield point and the unit is Pa.sn and is the is shear stress and the unit is mPa.
The Herschel-Bulkley model is an extension of the Bingham Plastic model to include shear rate dependence. Mathematically, it is expressed as follows:
 (3)
(3)
where t is the shear stress, to – yield stress, h - viscosity, - shear rate, n – flow index, and k – index of consistency.
The Casson rheological model is structure-based (Becker et al., 2003) used to describe the flow of visco-elastic liquids. This model has a more gradual transition from Newtonian to Yield. Mathematically, the Casson model is expressed as the relation (4).
 (4)
(4)
where τ0 is yield stress and the Casson plastic viscosity. We note that the Eq. 1 is valid for (τ ≥ τ0) and we must consider = 0 when τ ≤ τ0.
Material and Methods
Types of soybean oil used in this paper are produced in CEREALCOM SA Rosiorii de Vede (Romania).
The determination of dynamic viscosity was realized with a viscosimeter using a Haake VT 550 Viscotester when the HV1 viscosity sensor is used. Dynamic viscosity was determined at seven shear rates 3.3, 6, 10.6, 17.87, 30, 52.95, 80, and 120 s-1, the temperature varying between 40 and 100°C. To change and control the working temperature value was used a thermostatic bath. Measurements were made starting from 40°C temperature and at each 10°C more till was reached the temperature of 100°C.
Result and Discussion
The model of (Eq. 4) is due to the Casson model (Coussot et al., 2002; Stanciu, vol. 6; Stanciu, 2019; Stanciu, 2018; Stanciu, 2018; Stanciu, 2018; Santos et al., 2005; Agwu et al., 2015) characterized by yield stress (τ0) and it has been widely used for modeling certain biological fluids. The suggested model is to expand the model from linear dependence to a second degree polynomial expressed as follows:
 (5)
(5)
where Ai are three free adjustable parameters that can be determined with non-linear regression.
Table 1 summarizes the results of the two different fits (Eq. 5) for seven different temperatures. Overall, the correlation coefficient (R) is better for the proposed model (Eq. 5) when (A2 ≠ 0) than of the usual Casson model (Eq. 4) when (A2 = 0) in Eq. 5. Nevertheless, we observe quasi-equality between 60 and 70 °C when the sign of A2 changes.
Table 1. Optimal coefficients (Ai) for general Eq. (5) and correlation coefficient (R) for the square root of shear stress, Casson model (Eq. 4, A2 = 0), and that for the proposed equation (Eq. 5, A2 ≠ 0).
|
T / °C |
T / K |
A0 |
A1 |
A2 |
R |
|
40 |
313.15 |
1.9609 |
4.2955 |
0 |
0.99973 |
|
3.0624 |
3.8267 |
0.037433 |
0.99997 |
||
|
50 |
323.15 |
2.5924 |
2.9850 |
0 |
0.99967 |
|
3.2556 |
2.7027 |
0.022537 |
0.99985 |
||
|
60 |
333.15 |
2.3246 |
2.9273 |
0 |
0.99983 |
|
2.3981 |
2.8960 |
0.0024989 |
0.99983 |
||
|
70 |
343.15 |
2.2818 |
2.8307 |
0 |
0.99983 |
|
1.9959 |
2.9524 |
-0.0097154 |
0.99990 |
||
|
80 |
353.15 |
2.2039 |
2.7512 |
0 |
0.99975 |
|
1.6498 |
2.9871 |
-0.018829 |
0.99990 |
||
|
90 |
363.15 |
2.5077 |
2.7582 |
0 |
0.99916 |
|
1.4023 |
3.0487 |
-0.037567 |
0.99983 |
||
|
100 |
373.15 |
2.3556 |
2.5506 |
0 |
0.99970 |
|
1.9256 |
2.7336 |
-0.014614 |
0.99980 |
Figure 1 shows the variation according to
at increasing shear rates. They show that the viscosity decreases rapidly with the shear rate in the high-temperature region, in contradiction with the high shear rate in the low-temperature region (Bingham, 1922; Stanciu, 2019; Stanciu, 2018; Stanciu, 2018; Stanciu, 2018). This tendency is in good agreement with the commonly accepted knowledge about the viscosity of vegetable oil.
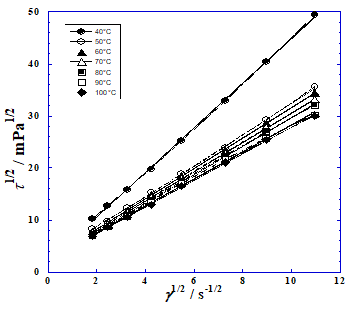
Figure 1. Variation of the square root of shear stress with the square root of shear rate at different temperatures. Dots represent experimental values and lines represent linear and non-linear fits.
Considering the dimensional equations for Eq. 5 and comparing with those of Casson model (Eq. 4), we can give some physical meaning for Ai-parameters for which Eq. 5 can be re-expressed as follows:
 (6)
(6)
where τ0 is yield stress and ηc the modified Casson plastic viscosity and δ is a corrective residual term indicating by its absolute value the extent of the deviation from the linearity of the Casson model (Eq. 4). Moreover, the sign of δ indicates if this deviation is positive (super Casson behavior) or negative (sub-Casson behavior) and which is null when the shear stress (τ) obeys strictly with the original Casson model. We note that the Eq. 6 is also valid for (τ ≥ τ0) and we must consider = 0 when τ ≤ τ0.
To examine the suitability of the proposed correlation equation, experimental data on soybean oil published in our previous works have been utilized (Stanciu, 2018; Stanciu, 2018; Stanciu, 2018) investigating the shear stress and dynamic viscosity at a different shear rate and different temperatures. The results of these systems have been compared with those achieved by the suggested expression, whereas Casson linear form arranging as comparing factor for the standard deviation σ assigned as:
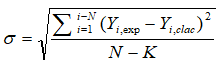 (7)
(7)
Whereas N is the number of experimental points (shear rate) and K is the number of free adjustable parameters (Ai) of the proper equation 5.
Using Eq. 8, Table 2 summarizes the parameter values of the two different models such as the Casson model (Eq. 4) and that calculated by the proposed equation (Eq. 6) for seven different temperatures (from 40 to 100 °C). We observe feeble standard deviation values (σ) for the extended Casson expression (Eq. 6) when the absolute value of the corrective residual term (δ) is far away from zero. Besides, Figure 2 uncovers this notice and shows preliminarily that the temperature range can be divided into two sub-intervals separated by an interesting temperature (Tcs) specific to the rheological behavior of the studied fluid which it is about 61.5 °C for our soybean oil and for which the corrective residual term (δ) cancels and the two models have the same value of standard deviation (σ). Globally, the standard deviation values σ related to the suggested model (Eq. 6) are less than of those of the Casson model (Eq. 4) in the entire studied range of temperature whether for negative or positive deviation (Fig. 6).
τ0 = A02 ; ηc = A12 and δ = A2 / A12 (8)
Table 2. Optimal coefficients for Casson model (Eq. 4, δ = 0) and that for proposed equation (Eq. 5, δ ≠ 0), standard deviations σ calculated by Eq. (7) related to the variation of the square root of shear stress vs. the square root of shear rate.
|
T |
T |
τ0 |
ηc |
δ ×103 |
σ |
|
°C |
K |
mPa |
mPa·s |
- |
(mPa)1/2 |
|
40 |
313.15 |
3.8451 |
18.451 |
0 |
0.32282 |
|
9.3783 |
14.644 |
2.5563 |
0.099024 |
||
|
50 |
323.15 |
6.7205 |
8.9102 |
0 |
0.25063 |
|
10.599 |
7.3046 |
3.0853 |
0.16911 |
||
|
60 |
333.15 |
5.4038 |
8.5691 |
0 |
0.17693 |
|
5.7509 |
8.3868 |
0.29796 |
0.16474 |
||
|
70 |
343.15 |
5.2066 |
8.0129 |
0 |
0.15269 |
|
3.9836 |
8.7167 |
-1.1146 |
0.13021 |
||
|
80 |
353.15 |
4.8572 |
7.5691 |
0 |
0.20126 |
|
2.7218 |
8.9228 |
-2.1102 |
0.12891 |
||
|
90 |
363.15 |
6.2886 |
7.6077 |
0 |
0.12179 |
|
1.9664 |
9.2946 |
-4.0418 |
0.10965 |
||
|
100 |
373.15 |
5.5489 |
6.5056 |
0 |
0.20386 |
|
3.7079 |
7.4726 |
-1.9557 |
0.16784 |
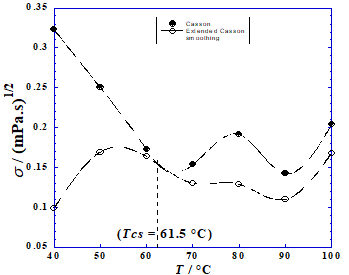
Figure 2. Comparison of standard deviations σ for the square root of shear stress (Table 1) calculated by Eq. (7), related to (●): Casson model (Eq. 4) and that (○): calculated by proposed equation (Eq. 6).
We note that the corrective residual term (δ) has small values for our experimental data (Fig. 3), which means that the deviation to the linearity of Casson (Eq. 4) is not so important for the soybean oil. Besides, this deviation is positive with concave curvature (super Casson behavior) for temperatures T < Tcs = 61.5 °C, negative with convex curvature (sub-Casson behavior) for T > Tcs = 61.5 °C and (δ) is null at T = Tcs = 61.5 °C i.e. when the shear stress (τ) obeys strictly to the original Casson model (Eq. 4).
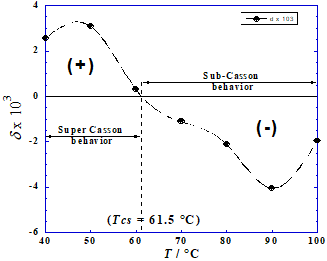
Figure 3. Variation of the corrective residual term (δ) of the extended Casson model (Eq. 6) as a function of temperature.
Figure 4 shows that the variation of the yield stress (τ0) against temperature can classifies the rheological property of soybean oil into two types such as a super Casson behavior (τ0,Casson-Stanciu > τ0,Casson , δ > 0) for temperatures T = < Tcs = 61.5 °C and a sub-Casson behavior (τ0,Casson-Stanciu < τ0,Casson , δ < 0) for temperatures T < Tcs = 61.5 °C. The values become equal when the temperature is equal to Casson-Stanciu (T = Tcs = 61.5 °C). Moreover, when we inspect the Table 2 and Figure 3, we discover that the yield stress difference is practically proportional to the corrective residual term (δ) when we neglect the low temperature (40°C) is excluded due to the special behavior discussed above for Fig. 2. In our case of soybean oil we obtain approximately the following relationship:
τ0,Casson-Stanciu − τ0,Casson = 1137 × δ (9)
where (τ0) values are expressed in mPa.
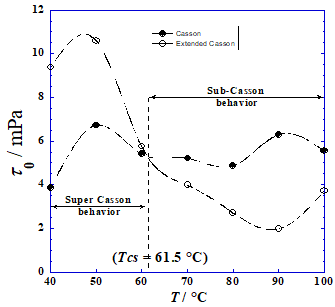
Figure 4. Variation of the yield stress (τ0) of Casson as a function of temperature.
Finally, Figure 5 shows the same behavior as the Fig. 4 except when we discard the low temperature (40°C), the Casson plastic viscosity difference is inversely proportional to the corrective residual term (δ) and it cancels when δ is null. In our case of soybean oil we obtain approximately the following relationship:
ηc,Casson-Stanciu − ηc,Casson = − 487.3 × δ (10)
where (ηc) values are expressed in mPa·s.
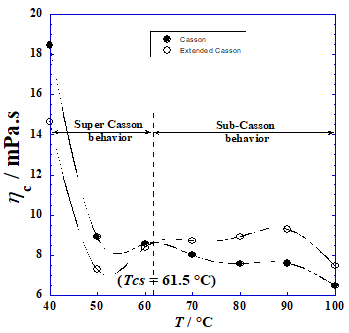
Figure 5. Variation of the Casson plastic viscosity (ηc) of Casson as a function of temperature.
Since the rheological properties of soybean oil little deviate from the linearity of the Casson model, we cannot observe clear the power of the proposed model. So, to better see its goodness, we tested it for another situation such as ketchup taken from the literature (Smigielska et al., 2013) and which is more deviated from the linearity of Casson. In this system, authors studied the effect of different ingredients on commercial textured tomato ketchup with modified regular corn starch in terms of rheological properties (Smigielska et al., 2013). Figure 6 and Table 3 present the results of the test and comparison between the two models (Eqs. 4 and 6).
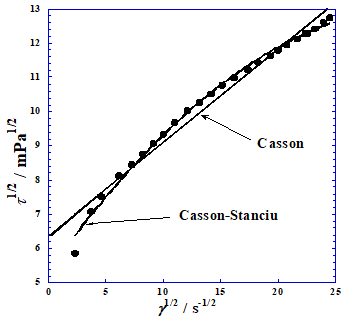
Figure 6. Variation of the square root of shear stress of ketchup with the square root of shear rate at different temperatures. Dots (●) represent experimental values and lines represent linear and non-linear fits.
Table 3. Optimal coefficients for Casson model (Eq. 4, δ = 0) and that for proposed equation (Eq. 5, δ ≠ 0), correlation coefficient (R) and standard deviations σ calculated by Eq. (7) related to the variation of the square of shear stress vs. the square root of shear rate for the ketchup taken from the literature (Smigielska et al., 2013).
|
Model |
T |
τ0 |
ηc |
δ ×103 |
R |
σ |
|
°C |
mPa |
mPa·s |
- |
- |
(mPa)1/2 |
|
|
Casson |
25 |
40.590 |
0.07383 |
0 |
0.98599 |
0.31882 |
|
Casson-Stanciu |
28.294 |
0.22127 |
- 32.21 |
0.99727 |
0.14112 |
Through the improvement of the values of the correlation coefficient (R) and the standard deviations σ (Table 3), we can see the goodness of the proposed extension. We can add that Fig. 6 shows that the values of the square of shear stress diverge from experimental values at very low values of shear rate which is due to the linearity of Casson model, while the non-linearity of Casson-Stanciu expression permits to more reduce this deviation to experimental data at low values of shear rate and exhibit a very feeble discrepancy.
Conclusions
This article proposes a new rheological model extending the linear Casson model to a non-linear one which can be called (Casson-Stanciu) expression. This new equation is correlated to our previous rheological data of vegetable oils but especially to soybean oil and for ketchup taken from the literature (Izadi et al., 2018; Nizkii et al., 2020). This model is characterized by an additional adimensional adjustable parameter called the corrective residual term (δ) which reflects the amount and sign of the deviation to the Casson linearity (i.e. concave or convex curvature) expressing in term of square root, the shear stress-shear rate dependence and classifying then the nature of the non-Newtonian fluid, according to the temperature value, as a type of super Casson or sub-Casson behavior in all the studied range of temperatures characterized by a sign-change temperature revealing, then an interesting overturning temperature (Tcs) which can be called Casson-Stanciu temperature characterizing the studied fluid and it will be an excellent criterion of discussion, interpretation, and classification of rheological fluids behavior. In addition, the non-linearity of the proposed extension model has the vantage of reducing the discrepancy with experimental data at very low values of shear rate and enlarges then the validity domain comparing to the Casson model which can diverge at zero shear rates.
Due to the obtained improvements, we can ascertain that the suggested extended model can be used to correlate several rheological properties with a reliable correlation of numerous non-Newtonian fluids other than the vegetable oils.
Conflict of Interest
No potential conflict of interest was reported by the co-authors.
References
Agwu, O. E., Okon, A. N., & Udoh, F. D. (2015). A comparative study of diesel oil and soybean oil as oil-based drilling mud. Journal of Petroleum Engineering, 2015.
Ahmed, G. M., Fahmy, E. M., Elkholy, S. H., Semary, M., Mohammed, A. A., & Badawy, W. M. (2018). Cortical activation after constraint induced movement therapy in stroke patients: A randomized controlled trial. Journal of Advanced Pharmacy Education & Research| Jul-Sep, 8(3), 25.
Becker, T. E., Morgan, R. G., Chin, W. C., & Griffith, J. E. (2003, January). Improved rheology model and hydraulics analysis for tomorrow's wellbore fluid applications. In SPE Production and Operations Symposium. Society of Petroleum Engineers.
Bingham, E. C. (1922). Fluidity and Plasticity. McCraw-Hill Book Company. Inc., New York, London.
Casson, M., (1959), The Rheology of Disperse Systems. Pergamon press, London.
Coussot, P., Nguyen, Q. D., Huynh, H. T., & Bonn, D. (2002). Viscosity bifurcation in thixotropic, yielding fluids. Journal of rheology, 46(3), 573-589.
Hemphill, T., Campos, W., & Pilehvari, A. (1993). Yield-power law model more accurately predicts mud rheology. Oil and Gas Journal;(United States), 91(34).
Herschel, W. H., & Bulkley, R. (1926). Konsistenzmessungen von gummi-benzollösungen. Kolloid-Zeitschrift, 39(4), 291-300.
Izadi, M. A., Valiani, A., Bahramian, H., Esfandiari, E., & Hashemibeni, B. (2018). Which factor is better for cartilage tissue engineering from human adipose-derived stem cells? Kartogenin or avocado soybean unsaponifiable. Pharmacophore, 9, 140-148.
Murari, K., Gupta, A., Kumar Dubey, A., Singh, A., Kumar Mishra., U. (2019) Development of Sustained Release Floating Tablet for Cefpodoxime Proxetil (CP). International Journal of Pharmaceutical and Phytopharmacological Research, 9(2), 96-105.
Nizkii, S., Kodirova, G., & Kubankova, G. (2020). Determining the Amino Acid Composition of Soybean Proteins Using IR Scanners. International Journal of Pharmaceutical Research & Allied Sciences, 9(2), 45-49.
Reiner, M. (1926). Ueber die Strömung einer elastischen Flüssigkeit durch eine Kapillare. Kolloid-Zeitschrift, 39(1), 80-87.
Santos, J. C. O., Santos, I. M. G., & Souza, A. G. (2005). Effect of heating and cooling on rheological parameters of edible vegetable oils. Journal of food Engineering, 67(4), 401-405.
Smigielska, H., Lewandowicz, J., & Le Thanh-Blicharz, J. (2013). Effect of Type 4 Resistant Starch on Colour and Rheological Properties of Tomato Ketchup. Zywnosc-Nauka Technologia Jakosc, 20(2), 137-149.
Stanciu, I. (2018). Rheological Behavior of Soybean Oil. Journal of Science and Arts, 18(2), 453-458.
Stanciu, I. (2018). Rheological Mathematical Models of Dependence Dynamic Viscosity–Shear Rate for Soybean Oil. Journal of Science and Arts, (4), 1001-1006.
Stanciu, I. (2018). Rheological Study Behavior of Soybean Oil. Journal of Science and Arts, 18(3), 711-716.
Stanciu, I. (2019). Rheological Investigation of Soybean Oil from Soya Beans. Journal of Science and Arts, 19(4), 983-988.
Stanciu, I. New Models Polynomial Experimental of Variation Dynamic Viscosity–Temperature For Soybean Oil, MAGNT Research Report, 6(1), 26-29.