Adsorption and Optical Color Decomposition of Congo Red Blue Solution Using Graphene Oxide / MnO2 Nano Composite
Amir Fadhil Dawood AL-Niaimi, Raghad Laith Kamel*
Received: 03 August 2019 / Received in revised form: 19 January 2020, Accepted: 28 January 2020, Published online: 28 February 2020
© Biochemical Technology Society 2014-2020
© Sevas Educational Society 2008
Abstract
The Nanocomposites consist of graphene oxide (GO) nanosheets and Magnesium oxide (MnO2), with a weight ratio of 1:1 to the synthesized GO /MnO2. The synthesized samples were characterized using FT-IR, SEM. The adsorption of Congo red (CR) dye from aqueous solution onto GO/MnO2 NCs as adsorbent using the batch method were investigated under different laboratory conditions such as contact time, dose of GO/MnO2, temperature and initial concentration of CR dye. Adsorption isotherms are used to test adsorption data for Langmuir, Freundlich, Dubinin, and Temkin, because it is suitable to Temkin isotherm. Thermodynamic functions (Δ ºH, Δ ºG, ΔºS ) of the adsorption were calculated, which show the adsorption endothermic process and the Δ ºG values were negative, meaning that the adsorption occurred spontaneously. The ΔºS values were positive, meaning that the movement of the dye molecules is unrestricted. The Kinetic data were proportional to -pseudo-second order. We also investigate the photodegradation of CRdyeon GO/MnO2 under different conditions (with and without sunlight, GO/MnO2 and light source), we calculated Photodegradation percent and kinetic photodegradation. The bestcondition for photodegradation was GO/MnO2NCs + CR + O2 gas + Vis lamplight.
Key words: Adsorption, Congo red dye, Thermodynamics, Kinetic, Photodegrdation
Introduction
Congo red (CR) is benzidine- based diazione anion, a water-soluble direct dye, known to metabolize to benzidine, a known human carcinogen (Ahmad and Kumar, 2010). It is widely used in the textile, printing, paper leather and plastic industries. It causes irritation to eyes and skin (Abbas and Trari, 2015). Of all the physical, chemical and biological treating strategies, adsorption still remains the most simple, low cost and most effective treatment for dye effluents (Chen and Zhao, 2009). Several adsorbents have been reported in the literature such as agriculture waste, leaves of Aloe Vera chitosan/montmorillonite Nanocomposite (Wang and Wang, 2007), rice husk, bentonite (Bulut et al.2008), rice hull ash (Chou et al., 2001), leaf of Azadirachta indica (Shankar et al., 2004), Jujuba seeds (Reddy et al., 2012), red mud (Tor and Cengeloglu, 2006), tea waste (Foroughi et al., 2015), eucalyptus wood (Mane and Babu, 2013), MgO nanoparticles to remove Congo red from aqueous solution.
The physical properties of nanomaterial materials are quite different from the bulk material which makes the nanomaterial more applicable (Mohammed et al.2018; ShafaeeFard et al. 2018; Ashjaran. 2019; Shrivastava et al. 2019; Al-Bishri, W. M. 2018). Surface properties such asporosity, morphology, and size of the particles determine to the specific surface area and adsorption capacity of the nanomaterial. Therefore, the purpose of the present study was to evaluate the performance of Graphene oxide /MnO2 (GO/MnO2) Nanocomposite as an adsorbent to remove Congo red from its aqueous solutions. Optimization of some factors. Including contact time, initial dye concentration. the dose of adsorbent and temperature, kinetics, isotherms, and thermodynamics studies are necessary to suggest possible mechanism of the adsorption process.
Experimental
Instruments: UV-Visible (Shimadzu, Japan 1700) was used to measuretheconcentration of dye in aqueous solution. The pH of all solutions in this study was recorded using a German pH meter (7110) (wtw). Temperature control wasperformed using isothermal bath shaker (BS-11, Korea). XRD measurementsconditions are 40 kv, 30 mA, 10-120° scanning range and the scanning speed 5 deg/min. The FTIR (Shimadzu (IR PRESTIGE 21) with KBr pellet technique. The effective range was 400 to 4000 cm-1, AFM (SPM-AA3000, Advanced Angstrom Inc.), SEM (Type Tescan Brno-Mira 3LMU). All of the chemicals were used without further purification.
GO Preparation
GO was prepared according to the modified Hummers method (Tavakoli et al., 2015). In summary, Initially, 2 g of graphite powder was added to 50 ml of sulfuric acid (98 wt %) and mixed with 2 g of sodium nitrate in a 500 mL flask in an ice bath at 0° C. The stirring was carried out vigorously, with 6 g of potassium permanganate gradually added to the flask and stirring for 2 hours. After this step, 100 ml of deionized water (DI) was added to the solution and the temperature of the solution was rapidly increased to 98° C and kept at this temperature for 30 minutes. The next step was added 300 ml of Diss water to the flask. Then, 20 ml of hydrogen peroxide solution (30 wt %) was added, to turn yellow the mixture. The mixture was filtered and washed several times with hydrochloric acid solution (5 %) and deionized water to remove residual material. Finally, GO was synthesized by sonication for 60 min and drying at 60 °C.
Synthesis of MnO2 Nanoparticles
MnO2 nanoparticles are produced by mixing an aqueous solution of KMnO4 and MnSO4 at ambient temperature and pressure. To adjust the pH of the solution, the pH of the mixture was adjusted ≈ 1, with the concentration of 1.84 g for HNO3.1.84 g of and KMNO4 (dissolved in 31.25ml H2O) was mixed with 2.75 g of MnSO4 (dissolved in 9. 5 ml H2O) at ambient temperature and pressure. The reaction product was incubated for 24 hours at 80ºC, filtered, washed with water until the pH reached 6, and dried at 110 ºC (Xiao et al., 1998; Pang et al., 2012).
Synthesis of GO/MnO2 NCs
The ratio of GO/MnO2 NCs (1:1) was prepared by the impregnation method. In summary, 1g of GO was added to a baker with 1L DI water and obtained for 60 min.1g of MnO2 nanoparticles wa added to the dispersion baker. After 30 min of sonication, the suspension was collected by centrifuging and drying at 60 ºC.
Synthesis of Congo red dye solution
Congo red dye is water-soluble (λ max 497 nm). The standard solution (1000 mg/L) was prepared by dissolving 1g of Congo red dye in 1L of D1 water. The experimental solution was prepared by diluting the standard dye solution with DI water to give a suitable concentration of the desired solutions (10-50) ppm and the solutions remained homogeneous for 24 hours. The UV-Visible spectrometer was used to determine the calibration curve for the Congo red dye λ max (497 nm). The dye adsorption by the batch process to investigate various parameters such as contact time (10-50 min), adsorbent dose (GO/MnO2NCs) (0.01-0.05g), concentration of dye (10-50) ppm temperature (20- 40°C). The samples were shaken and kept in a thermostat for 20 min. The samples were then filtered in a centrifuge for 15 min (at 3500 rpm) and then filtered again and analyzed spectrophotometrically. The percentage of dye adsorption from aqueous solution was determined according to the following equation (Adsorption percentage).
%adsorption =Co- CeCo × 100 (1)
where Co is the initial concentration of dye solution (mg/L) and Ce is the final concentration (mg/L) after the adsorption. The adsorption capacity Qe (mg/g) was calculated by equation (2).
Qe =C0-Cem  × Vsol (2)
Qe: Adsorbed amount of solute per unit weight of adsorbent (mg/g). Ce: Equilibrium concentration of solute (mg/L). Vsol: Volume of solution (L).m: adsorbent mass (g).
Results and Discussion
In our previous work, GO and MnO2 Nanoparticles were characterized using FTIR, XRD, SEM and AFM. The specific area of the adsorbents surface should be determined if any physical-chemical interpretation of its behavior as an adsorbent is to be possible. surface properties were provided by nitrogen adsorption at 77 K, which is the equilibrium temperature between the vapor and liquid phase.
The surface results of the Nanocomposite (GO/MnO2) are 13.646m²/g. The FT-IR spectrum of GO/MnO2 NCs was shown in figure (1). Metal oxides generally fingerprint absorption bands. Below 1000 cm-1 arising from inter-atomic vibrations (520,458 cm-1) .The observed peak over 3500 cm-1 is related to the presence of hydroxyl groups comes of the reaction between the surface of GO/MnO2 NCs with water vapor in the air. The band at 3074 cm-1 is assigned to the appearance of the stretching of –OH. peaks at 1724 cm-1 and 1577 cm-1 correspond to C= O and C= C stretch. The bands located at 1239 cm-1 and 1095 cm-1 are assigned to C- OH stretching and C-O-C stretching vibrations mode of sp2 carbon skeletal, respectively. SEM images with different magnification power of GO/MnO2 NCs are shown in figure (2), where GO surfaces are covered by rod-like nanoparticles of MnO2. From the SEM images, it is evident that MnO2 particle are heterogeneously anchored to the GO sheets. Go sheets show agglomerated leaf-like structure.
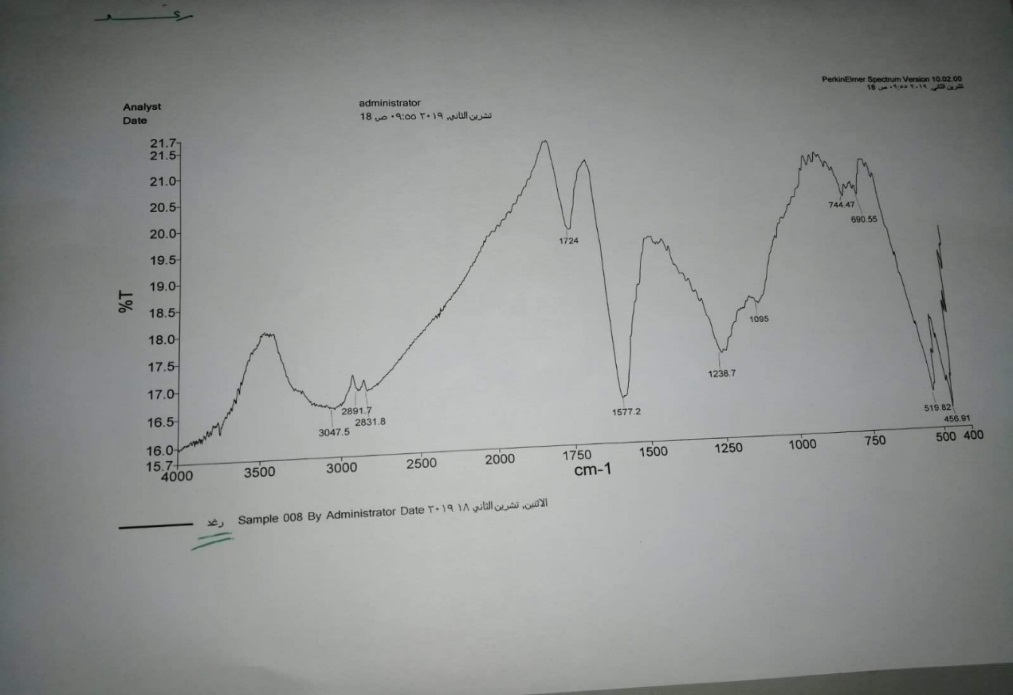
Figure 1: FT-IR spectra of GO /MnO2 Nanocomposite
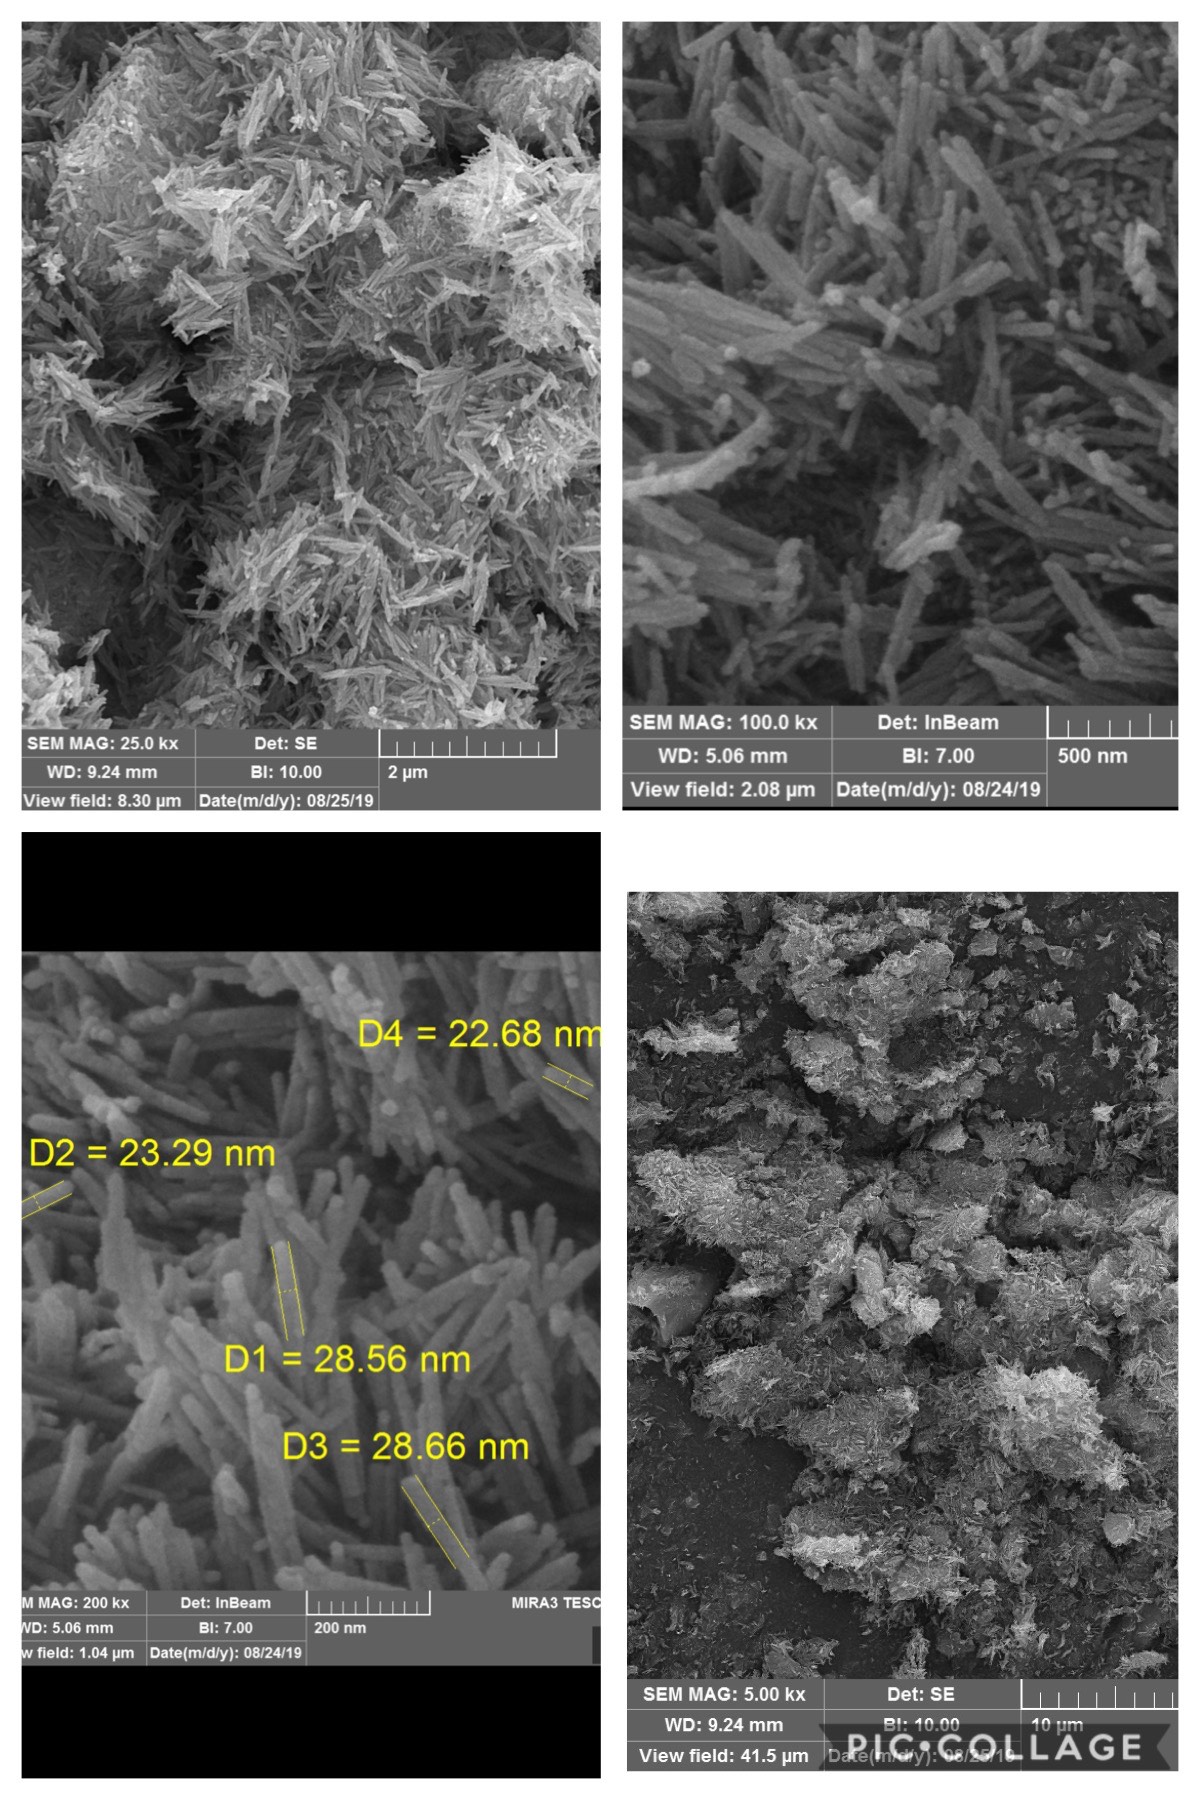
Figure 2: SEM images with different magnification power of GO/MnO2 NCs
Adsorbent Weight
the effect of adsorbent on dye removal percentage was investigated using different amounts of GO/MnO2 (0.01 to 0.05 g). the results (Figure 3) showed that the best removal ability was obtained at 0.05 gm.
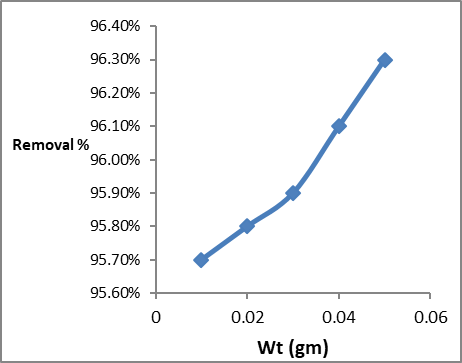
Figure 3: Effect of adsorbent weight on adsorption of Congo red dye on GO/MnO2
Determination the adsorption time Equilibrium
Several adsorption experiments were performed in thecontact time range of 10-50 min (figure 4). The rate of dye removal on GO/MnO2 gradually increased with increasing contact time from 10 to 50 min and then remained constant with further increase in contact time. Therefore, a 40 min period of equilibrium was chosen for further studies. Initially, dye contact quickly with many available active sites on the surface of GO/MnO2, resulting in the fast adsorption. Increasing the contact time gradually decrease the available active sites, and weakened the driving force, resulting in a slower adsorption process and longer time to achieve adsorption equilibrium.
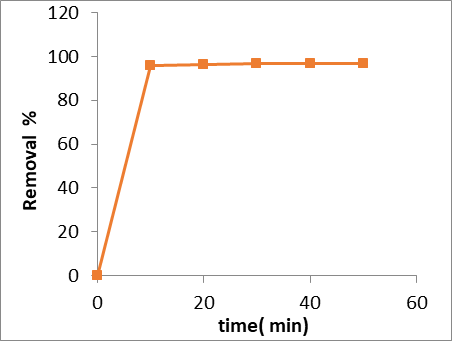
Figure 4: Influence of equilibrium time on Congo red dye adsorption on GO/MnO2 nanoparticles at 25 ºC C0 = 30ml of 10ppm, does of GO/MnO2 0.05 gm, and pH=7
Influence the concentration of dye on the adsorption rate
Figure (5) shows the effect of the concentration of dye (10-50ppm) on the percentage removal of dye removal. Our results showed that the best removal efficiency was obtained at 10 ppm.
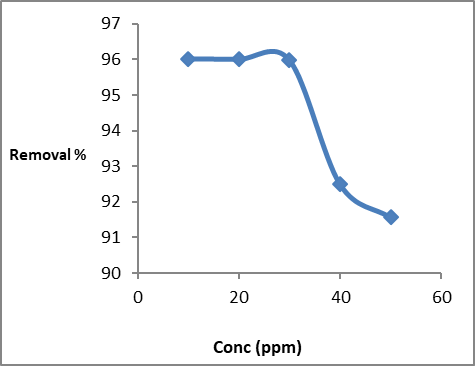
Figure (5): Effect of dye concentration on Congo red adsorption on GO/MnO2 Nanocomposite
This showed that dye adsorption kinetics in GO / MnO2 diffusion is not dispersed (Chia et al. 2013).
Adsorption Kinetics
In order to investigate the rate of the adsorption process, both -pseudo-first - order and pseudo second - order kinetics were applied to experimental data for all GO / MnO2 at initial 10ppm CR concentration (Lagergren, 1898).
ln (qe - qt) = ln qe – k1 t (3)
t / qt = 1/ k2 qe2 + (1/ qe) t (4)
Where qe and qt (mg/g) are the amounts of dye adsorbed at equilibrium and time t, respectively; k1 and k2 are the pseudo-first-order rate (min-1) and the pseudo-second-order (g/mg.min). By comparing their correlation coefficients (R2), the plots of equations were evaluated for the best fit. Figures 6 and 7 show the direct plots of ln qe- qt vs. t and t/qt vs. t, respectively. The correlation coefficients of the linear curves of both kinetics indicate that this process is likely to follow the second-order kinetics. The Pseudo-second order model assumes that the rate-limiting step involves the chemical adsorbtion on the adsorbent. By fitting the experimental data (Figures 6 and 7), the adsorption rate constant for each model was calculated and summarized in Table 1. As can be seen from the table, the kinetics data were well fitted by the pseudo-second-order, as demonstrated by the obtained higher regression coefficient (R2). In addition, the calculated qe values for the pseudo-second order is highly matched with the experimental data as compared with those of the pseudo-first order model. This showed that the adsorption kinetics of dye in GO/MnO2 diffusion is not controlled (Chia et al., 2013).
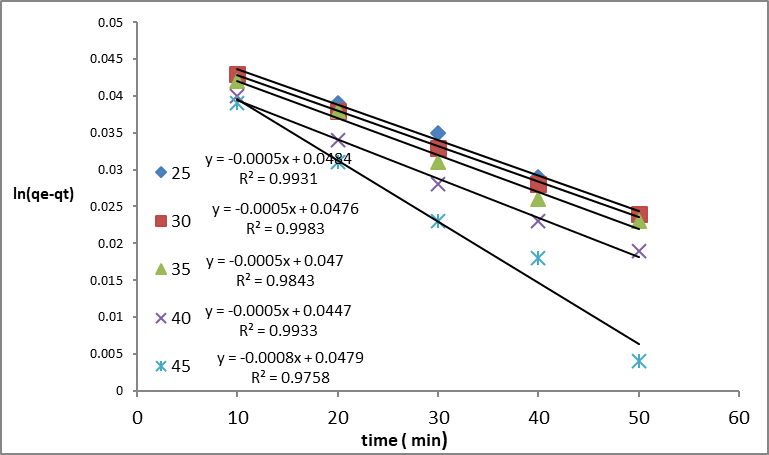
Figure 6: first – order Lagergren pseudo reaction at different temperatures
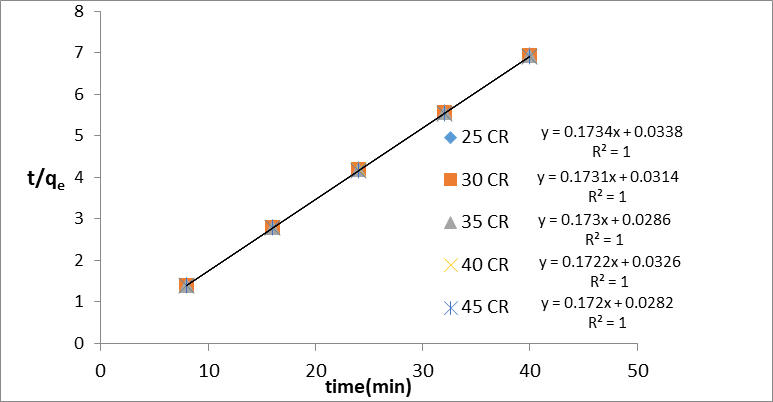
Figure 7: Lagergren Pseudo second–order reaction at different temperature
Table 1: Kinetics parameters for Congo red adsorption in GO/MnO2 nanoparticles
|
pseudo-second–order |
pseudo-first-order |
|
T (c0) |
Co |
|
|||||||
|
|
R2 |
K2 g.mg1.min-1 |
qe (calc.) |
R2 |
qe (calc.) |
qe (exp.) |
K1 Min-1 |
|
10 Ppm |
|||
|
|
1 |
0.8896 |
5.761 |
0.9931 |
0.0189 |
5.761 |
0.0005 |
25 |
||||
|
|
1 |
0.9427 |
11.539 |
0.9983 |
0.0186 |
5.767 |
0.0005 |
30 |
||||
|
|
1 |
1.0465 |
17.277 |
0.9843 |
0.0182 |
5.781 |
0.0005 |
35 |
||||
|
|
1 |
0.9096 |
22.200 |
0.9933 |
0.017 |
5.790 |
0.0005 |
40 |
||||
|
|
1 |
1.0491 |
27.472 |
0.9758 |
0.0143 |
5.796 |
0.0008 |
45 |
||||
Adsorption of Isotherms
In this study, isotherms (Freundlich, Timken, and Dubinin-Kaganer-Radushkevich) were applied to experimental batch adsorption data to explain the dye –(GO/MnO) interaction. The Langmuir isotherm model assumes monolayer coverage of the adsorbate over a homogenous adsorbent surface, (Fungaro et al., 2011). experimental adsorption data are used on the Langmuir empirical isotherm.
𝐶𝑒/𝑄𝑒 = 1/qmax KL + Ce /qmax (5)
Where Ce is the equilibrium concentration of dye (mg/L); qmax, Qe is the maximum adsorption capacity proportional to the full coverage of a layer on the surface (mg/g) and the equilibrium capacity (mg/g), respectively; and KL is Langmuir constant (L/mg) related to energy of sorpation. The linear relationship (Ce/Qe) versus (Ce) shows a straight line of slope 1/qmax and intercept (1/KL qmax) (Figure 8). Table 2 shows that for the Langmuir model, the maximal value of adsorption qmax was negative, indicating that this model is inadequacy to explain the explain the adsorption process, although it shows a good linearity compared with other models. A dimensionless constant separation factor of Langmuir isotherm (RL) was also calculated using equation (6): The value of RL< 1 is favorable.
RL = 1/ (1 + KL Cₒ) (6)
The Frenudlich model is a case of multilayer adsorption and adsorption on heterogeneous surface energies and shows the exponential distribution of active sites. linear form of this model is represented by:
ln Qe = ln KF + 1/n ln Ce (7)
The Frenudlich KF and n constants show the adsorption capacity and the adsorption intensity is calculated in terms of the intercept and slope of plot ln Qe versus ln Ce, respectively (Figure 9). Adsorption intensity (n) showed the values (n >1) indicating a desirable removal state (Fungaro et al., 2011). The Freundlich constant (KF) decreases with increasing temperature, and this is an indication for the exothermic reaction. The Dubinin–Kaganer–Radushkevich (DKR) isotherm that can provide the adsorption mechanism and energy of adsorption process, which is expressed as a linear form:
Ln qe = lnqmax − β ε2 (8)
where qe is the adsorption quantity of Congo red (mmol g−1). qmax, β, and ε are the DKR single-layer adsorption capacity (mmol g−1), adsorption energy constant (mol 2 .J−2) , and Polanyi potential (J mol−1), respectively. ε can be represented as follows:
ε = RT ln (1 + 1/ce) (9)
β and qmax can be derived from the plot of lnqe vs. ε2 as shown in figure (10). The adsorption energy of E, (J .mol−1) can be obtained by the following equation:
E = (-2β) −0.5 (10)
If E values are less than 8 KJ/mol, the mechanism may be physical adsorption, while E values between 8-16 KJ/mol were assumed that the adsorption is controlled by ion exchange and E greater than 16 KJ/mol presume a particle diffusion mechanism (chemical process). It can be observed that the value of E may be physical (electrostatic nature) . Temkin isotherm has a factor that indicates the interaction between adsorbent and adsorbing particle so vividly. This model is used in the forms, called eqn:
Qe = B Ln kT + B ln ce (11)
B = RT/b (12)
By plotting qe against lnce gave the constants, KT and B which are the Temkin isotherm is related heat of adsorption (J/mol) constant KT is equilibrium bindinq constant (L/mg), R is the gas constant (8.314J/ mol .k). The Temkin Adsorption graph the qe against ln ce is plotted (Figure 11) and its calculated parameters (B,KT) are provided in Table 2. Table 2 summarizes the relevant isotherm parameters, their correlation coefficients (R2) for each parameter. According to R2 for each isotherm, the Temkin model fitted the experimental data best by linear analysis, while Langmuir has the fitted worst.
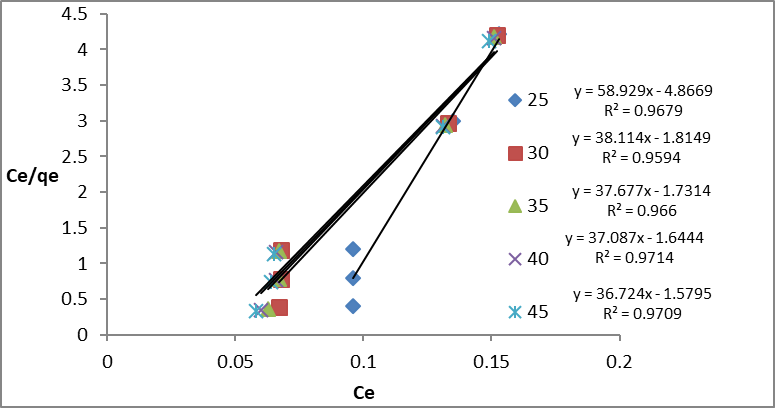
Figure 8: Langmuir Isotherm for Congo red dye in GO/MnO2 NCs at different temperature and concentration s of dye.
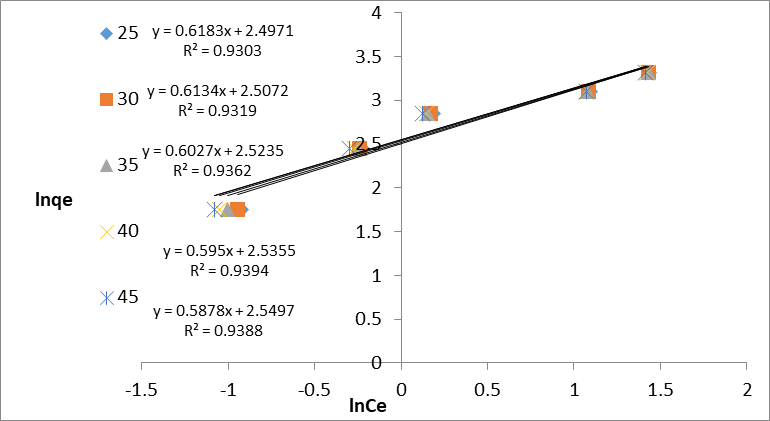
Figure 9: Freundlich Isotherm for Congo red dye at different concentrations and different temperatures on GO/MnO2 NCs
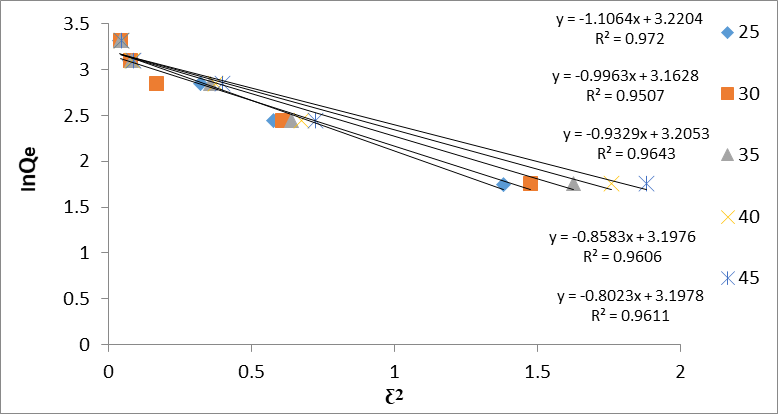
Figure 10: Dubinin Isotherm (DKR) for GO/MnO2 Congo red NCs with different temperature and concentration
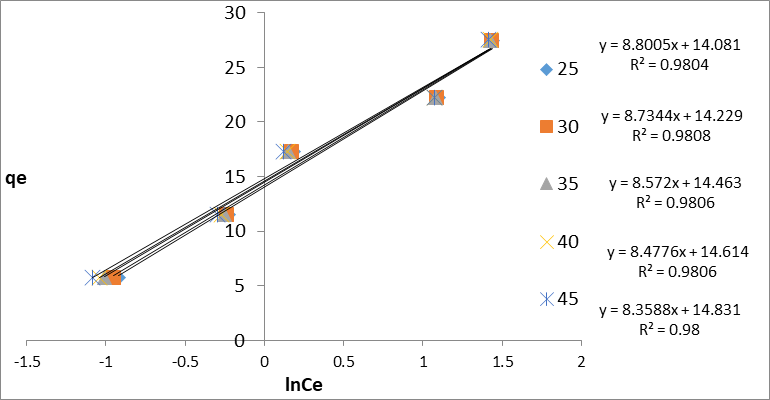
Figure 11: Temkin Isotherm for Congo red dye on GO/MnO2 NCs at different concentration and temperature
Table 2: Adsorption parameters calculated from the four isotherms used.
|
Langmuir |
Freundlich |
||||||
|
T(°C) |
KL |
R2 |
q max |
RL |
R2 |
1/n |
KF |
|
25 |
-12.1081 |
0.9679 |
0.0169 |
-0.0081 |
0.9303 |
0.6183. |
146012. |
|
30 |
-21.0000 |
0.9594 |
0.0262 |
-0.0047 |
0.9319 |
0.6134 |
12.270 |
|
35 |
-21.7284 |
0.9660 |
0.0265 |
-0.0045 |
0.9362 |
0.6027 |
12.472 |
|
40 |
-22.5535 |
0.9714 |
0.0269 |
-0.0044 |
0.9394 |
0.5950 |
12.6227 |
|
45 |
-23.2504 |
0.9709 |
0.0272 |
-0.0042 |
0.9388 |
0.5878 |
12.8032 |
|
DKR)) |
Temkin |
|||||
|
R2 |
E |
qmax |
β |
R2 |
B |
KT |
|
0.972 |
1.487 |
25.03 |
1.1064 |
0.9804 |
8.8005 |
4.9530 |
|
0.950 |
1.411 |
23.6336 |
0.9963 |
0.9808 |
8.7344 |
5.0991 |
|
0.964 |
1.365 |
24.6629 |
0.9329 |
0.9806 |
8.5720 |
5.4045 |
|
0.960 |
1.310 |
24.4737 |
0.8583 |
0.9806 |
8.4776 |
5.6058 |
|
0.961 |
1.2667 |
24.4786 |
0.8023 |
0.9800 |
8.3588 |
5.8961 |
Congo red color absorption rate on GO / MnO2 NCs with Temkin isotherm is suitable with a higher correlation coefficient (R2) values (Table 2). In the Dubinin isotherm (DKR), the energy equation allows us to understand the absorption mechanism of E <8KJ / mol. It is shown that absorption affects body strength, with a B value less than 40 KJ / mol indicating physical absorption.
Congo red dye adsorption on GO/MnO2 NCs with Temkin isotherm is suitable with higher correlation coefficient (R2) values (Table 2). In the Dubinin isotherm (DKR), the energy equation allows us to understand the adsorption mechanism of E< 8KJ /mol indicates that the physical force influence adsorption the B value less than 40 KJ/mol is an indication for physical adsorption. Thermodynamic parameters
The Thermodynamic parameter, the change in free energy (∆G◦), enthalpy (∆H◦) and entropy (∆S◦) were calculated using the following equation:
KC = Ae − ∆H / RT +∆S/R (13)
lnXm = −∆H/RT + K (14)
Where lnXm is the natural logarithm for the maximum amount adsorbed (mg/g), K is the constant of the Van’t Hoff equation, R is the universal gas constant (8.314.10-3 kJ/mol. K-1) and T is the temperature in Kelvin.
∆G° = − RT lnK (15)
K = Qe × m/Ce × V
∆G° = ∆H − T∆S° (16)
∆S°= ∆H − ∆G° / T (17)
∆H◦ and ∆S◦ were obtained from the slope and intercept of a Van’t Hoff plot of ln Xm versus 1/T, (Figure 12). And the values are presented in Table 3. The calculated thermodynamic parameters and the negative value of ∆H◦ meant that the endothermic adsorption processes was positive, the ∆G° value is negative, this indicate that the adsorption may be can happened spontaneously while the values of ∆S° was positive and that meaning the movement of molecules isn't limited.
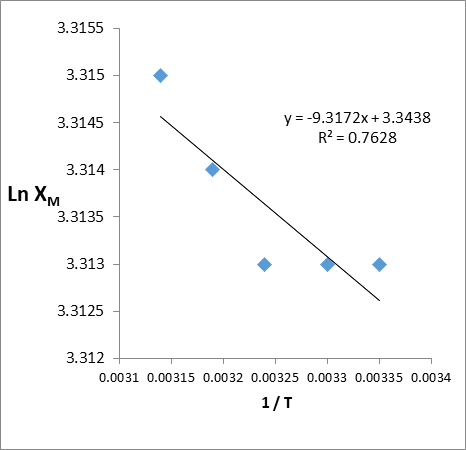
Figure 12: Natural logarithm Values for the maximum amount (ln Xm) versus 1/T for Congo red dye on GO/MnO2NCs.
Table 3: Values of thermodynamics functions for adsorption Congo red dye on GO/MnO2NCs
|
45 oC |
oC 40 |
oC 35 |
30 oC |
25 oC |
Thermodynamic function |
Ce (mg/L) |
|
0.0774 |
∆H kJ.mol-1 |
|
||||
|
-5.020 |
-4.918 |
-4.824 |
-4.730 |
-4.645 |
∆G kJ.mol-1 |
50ppm |
|
16.028 |
15.958 |
15.912 |
15.864 |
15.845 |
∆S J.mol-1 K-1 |
|
Photodegradation studies
In general, photodegradation studies were performed Via affixed values (0.05 gm) of GO/MnO2 NCs, after first placing them in photoreactor ( 250 ml), then 100 ml (10ppm) of dye in dark conditions for 40 min to achieve the adsorption-desorptionn equilibrium with stirring using magnetic stirring at 25ºC. The absorption of the samples was measured at λ= 497 nm. The degradation % is calculated as follows:
Deg % =(c0 - ct ) C0×100 (18)
(18)
Where co is the concentration of the first dye and ct is the concentration of dye in time irradiation (mg/l).
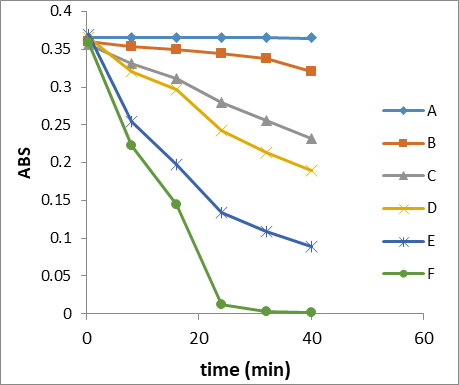
Figure 13: Reduction of dye absorption with time irradiation in different conditions
A – CR in dark; B- GO/MnO2NCs + CR in dark
C- GO/MnO2NCs + CR in absence of O2 gas + sunlight;
D- GO/MnO2NCs + CR + O2 gas + sunlight
E- GO/MnO2NCs + CR in absence of O2 gas + Vis lamp light;
F- GO/MnO2NCs + CR + O2 gas + Vis lamp light;
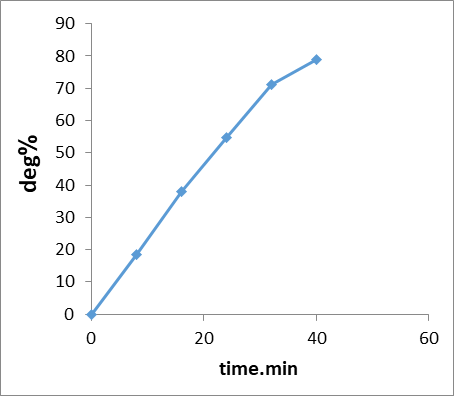
Figure 14: Degradation Photo (%) of dye on the GO/MnO2NCs with time irradiation
The change in the concentration of the dye solution during its degradation was used to find out the reaction kinetics. The CR photodegradation fitted best to the following pseudo first–order kinetic equation which is given ln At =ln A0 – kt , where A0 and At is the initial concentration of CR dye and at time t respectively, and K is the observed reaction rate constant (obtained from the slope of the line in plot of ln At versus time). Figure 15 shows the observed rate constant value was found to be 0.043 min-1 with a correlation coefficient value of 0.9944 . While the pseudo- second order kinetic equation is given by 1/At = k2t + 1/A0. The correlation coefficient value for the rate constant pseudo- second order is 0.9468 as shown in fig 16.
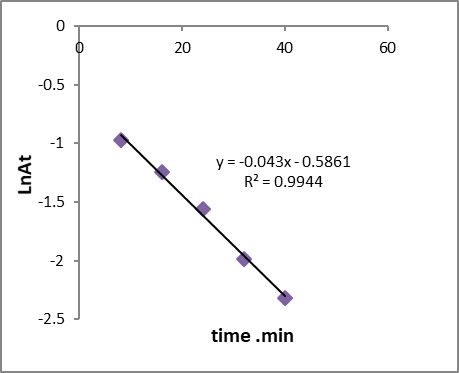
Figure 15: Pseudo first-order reaction for photocatalytic of dye on GO/MnO2NCs
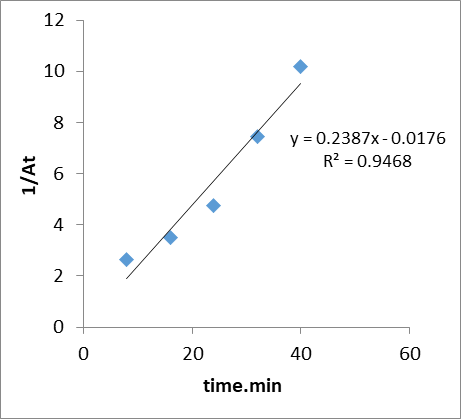 Figure 16: Pseudo-second order reaction for photo catalytic of dye on GO/MnO2NCs
Conclusions
GO/MnO2 NCs can be considered as an adsorbent and photocatalyst for the treatment of Congo red dye from wastewater. In the batch experiment, the effective of contact time, initial dye concentration, GO/MnO2 NCs amount, and temperature were showed to be effective. Removing dye dye is an endothermic process. It was found that the pseudo-second order model follows the adsorption process supported by the correlation coefficients of the linear plots, and qcal is very close to the q exp for the pseudo-second order rate kinetics.
The isotherm study shows four isotherm models, adsorption data proportional to the Temkin isotherm. Freundlich constant (KF) decreases with increasing temperature. In isothermal Dubinin (DKR), the energy equation is absorbed as perception of the adsorption mechanism, E < 8kJ /mol indicates the physical force influence. The kinetic data on the removal of CR dye under photocatalytic conditions under first-order kinetic equation. The best condition for photodegradation was GO/MnO2NCs + CR + O2 gas + Vis lamplight.
References
Ahmad, R., & Kumar, R. (2010). Adsorption studies of hazardous malachite green onto treated ginger waste. Journal of environmental management, 91(4), 1032-1038.
Al-Bishri, W. M. (2018). Toxicity Study of Gold and Silver Nanoparticles on Experimental Animals. Pharmacophore, 9(1), 48-55.
Ashjaran, A., & Sheybani, S. (2019). Drug Release of Bacterial Cellulose as Antibacterial Nano Wound Dressing. International Journal of Pharmaceutical Research & Allied Sciences, 8(3).
Bulut, E., Özacar, M., & Şengil, İ. A. (2008). Equilibrium and kinetic data and process design for adsorption of Congo Red onto bentonite. Journal of hazardous materials, 154(1-3), 613-622.
Chen, H., & Zhao, J. (2009). Adsorption study for removal of Congo red anionic dye using organo-attapulgite. Adsorption, 15(4), 381-389.
Chia, C., Nur, F. R., Mohd, S. S., Sarani, Z., Huang, N., & Lim, H. (2013). Methylene blue adsorption on graphene oxide. Sains Malaysiana, 42(6), 819-826.
Chou, K. S., Tsai, J. C., & Lo, C. T. (2001). The adsorption of Congo red and vacuum pump oil by rice hull ash. Bioresource Technology, 78(2), 217-219.
Foroughi-Dahr, M., Abolghasemi, H., Esmaili, M., Shojamoradi, A., & Fatoorehchi, H. (2015). Adsorption characteristics of Congo red from aqueous solution onto tea waste. Chemical Engineering Communications, 202(2), 181-193.
Fungaro, D. A., Yamaura, M., & Carvalho, T. E. M. (2014). Adsorption of anionic dyes from aqueous solution on zeolite from fly ash-iron oxide magnetic nanocomposite. Journal of Han, R., Ding, D., Xu, Y., Zou, W., Wang, Y., Li, Y., & Zou, L. (2008). Use of rice husk for the adsorption of congo red from aqueous solution in column mode. Bioresource technology, 99(8), 2938-2946.
Lagergren, S. K. (1898). About the theory of so-called adsorption of soluble substances. Sven. Vetenskapsakad. Handingarl, 24, 1-39.
Mahmoud, Z. H., & Khudeer, R. F. Spectroscopy and structural study of Oxidative degradation Congo Red Dye under sunlight using TiO2/Cr2O3-CdS nanocomposite. International Journal of ChemTech Research, 12(3), 64-71.
Mane, V. S., & Babu, P. V. (2013). Kinetic and equilibrium studies on the removal of Congo red from aqueous solution using Eucalyptus wood (Eucalyptus globulus) saw dust. Journal of the Taiwan Institute of Chemical Engineers, 44(1), 81-88.
Pang, S. C., Chin, S. F., & Ling, C. Y. (2012). Controlled synthesis of manganese dioxide nanostructures via a facile hydrothermal route. Journal of Nanomaterials, 2012.
Reddy, M. S., Sivaramakrishna, L., & Reddy, A. V. (2012). The use of an agricultural waste material, Jujuba seeds for the removal of anionic dye (Congo red) from aqueous medium. Journal of hazardous materials, 203, 118-127.
ShafaeeFard, S., Khanghahi, A. A., RoshandelMoghaddam, B., Ahmadian, A., & Ebrahimi, A. (2018). APPLICATION OF NANO COMPOSITES IN CALVARIA HEALING AND BONE DEFECTS: A LITERATURE OF REVIEW. Annals of Dental Specialty Vol, 6(1), 77.
Shankar, S. S., Rai, A., Ahmad, A., & Sastry, M. (2004). Rapid synthesis of Au, Ag, and bimetallic Au core–Ag shell nanoparticles using Neem (Azadirachta indica) leaf broth. Journal of colloid and interface science, 275(2), 496-502.
Shrivastava, B., Gopaiah, K. V., & Rao, G. S. (2019). Lipid-polymer based nano particles as a new generation therapeutic delivery platform for ulcerative colitis in vitro/in vivo evaluation. Int J Innov Technol Exploring Eng, 8, 3351-9.
Tavakoli, M. M., Tayyebi, A., Simchi, A., Aashuri, H., Outokesh, M., & Fan, Z. (2015). Physicochemical properties of hybrid graphene–lead sulfide quantum dots prepared by supercritical ethanol. Journal of nanoparticle research, 17(1), 9.
Tor, A., & Cengeloglu, Y. (2006). Removal of congo red from aqueous solution by adsorption onto acid activated red mud. Journal of hazardous materials, 138(2), 409-415.
Wang L, & Wang A. (2007). Adsorption characteristics of Congo Red onto the chitosan/montmorillonite nanocomposite. Journal of hazardous materials, 147(3):979-85.
Xiao, T. D., Strutt, E. R., Benaissa, M., Chen, H., & Kear, B. H. (1998). Synthesis of high active-site density nanofibrous MnO2-base materials with enhanced permeabilities. Nanostructured Materials, 10(6), 1051-1061.
